Figure 6.
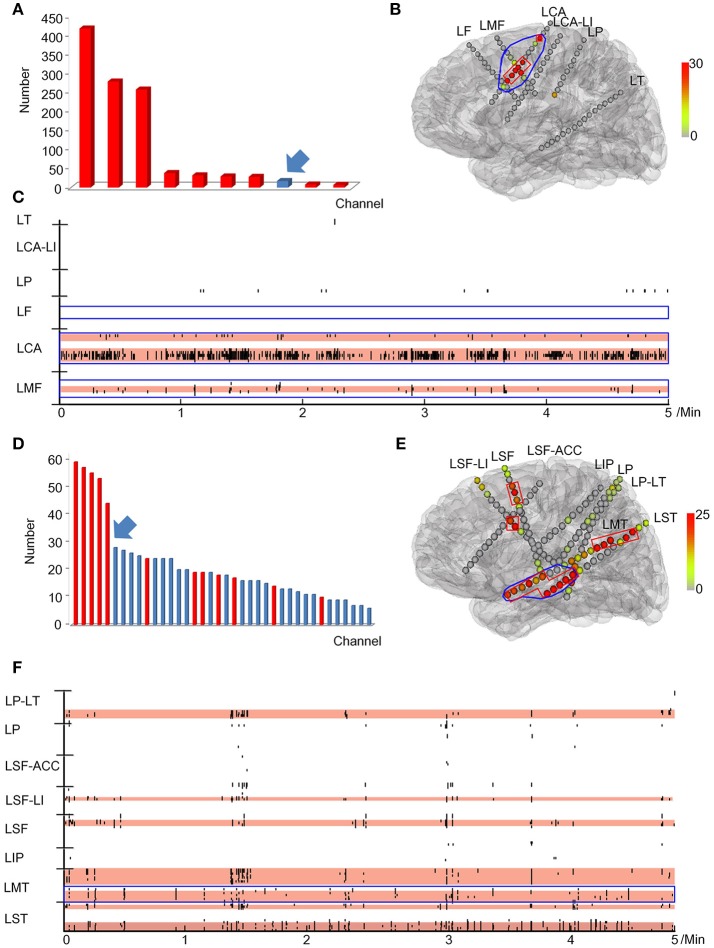
Example of a quantitative threshold for HFO distribution with which to delineate the EZ. (A-C) show the results of patient #13 (good post-surgical outcome) while (D,E) show the results of a poor post-surgical outcome. (A,D) show the rank in a descending order according to FRs rates. The channels which were resected are marked in red while the unresected channels are labeled in blue. Arrows indicate the first channel that was not continuously removed from the highest ranking. (B,E) show the FRs distribution on the individualized models of the patient brains. The number of HFO counts per electrode is represented by a different color. HFO counts are shown in red while the gray color indicates instances with a reduced HFO count. The resected area is delineated by the blue line and the EZ confirmed by our quantitative threshold is surrounded by a red line. LF, Left frontal; LMF, Left middle frontal; LCA, Left central area; LI, Left insula; LP, Left parietal; LT, Left temporal; LST, Left superior frontal; LMT, Left middle temporal; LIP, Left inferior parietal; LSF, Left superior frontal. (C,F) show the timing of all FRs detected in each channel by our automatic detector during a 5-min iEEG segment. The time and location of each FR are presented in terms of points. The resected area is delineated by the blue line. The pink regions show the EZ confirmed by our quantified threshold. In the patients with a good surgical outcome, the EZ was completely removed (B,C). However, the EZ of patients with poor outcome was not completely removed (E,F).

