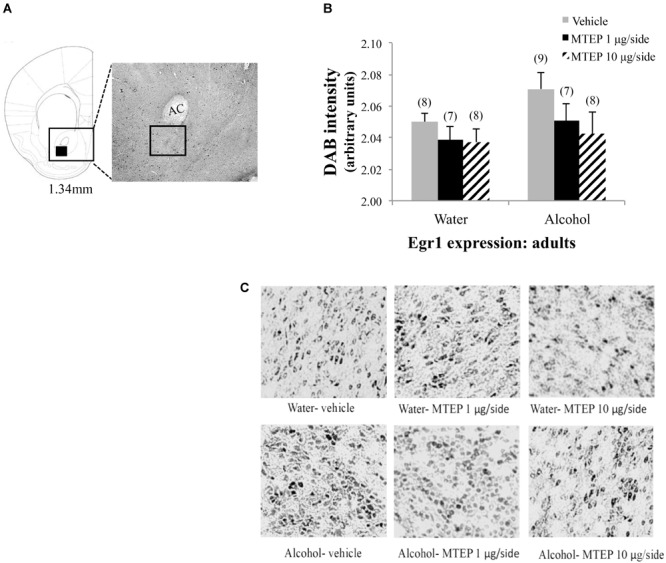
FIGURE 11.

Effects of MTEP and adult alcohol experience on Egr1 expression within the AcbC. (A) A representative anatomical depiction of a coronal section through the striatum, highlighting (black square) the approximate size and location of the sampling region used to assay the number of Egr1+ cells within the AcbC. (B) There were no significant effects of adult alcohol experience or intracranial drug treatment on Egr1 expression. (C) Representative micrographs of Egr1 immunostaining within the AcbC in each of the six treatment groups.
