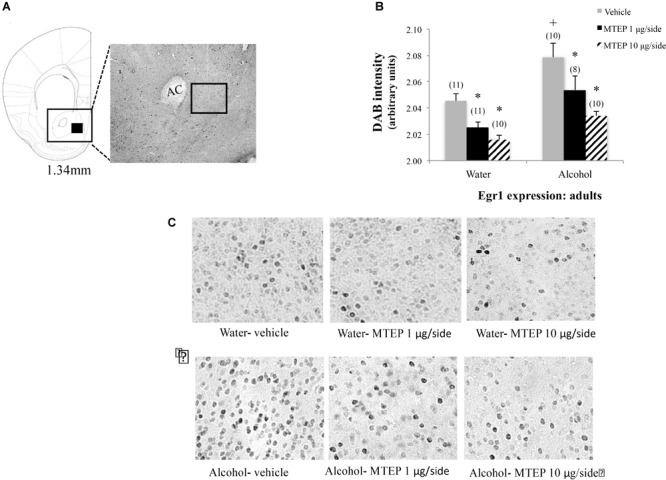
FIGURE 9.

Effects of intra-AcbSh MTEP and adult-onset alcohol consumption upon Egr1 expression within the AcbSh. (A) An anatomical depiction of a coronal section through the striatum, highlighting the approximate size and location of the sampling region used to assay the number of Erg1+ cells within the AcbSh (black square). (B) Overall, adult-onset alcohol-drinking control mice exhibited higher Egr1 expression within AcbSh, relative to water-drinking controls. Both 1 μg and 10 μg/side MTEP significantly reduced Egr1 expression compared to vehicle infusion, irrespective of drinking history. (C) Representative micrographs of Egr1 immunostaining within the AcbSh in each of the six treatment groups. ∗p < 0.05 treatment effect within same drinking group, +p < 0.05 drinking effect within same intracranial treatment group.
