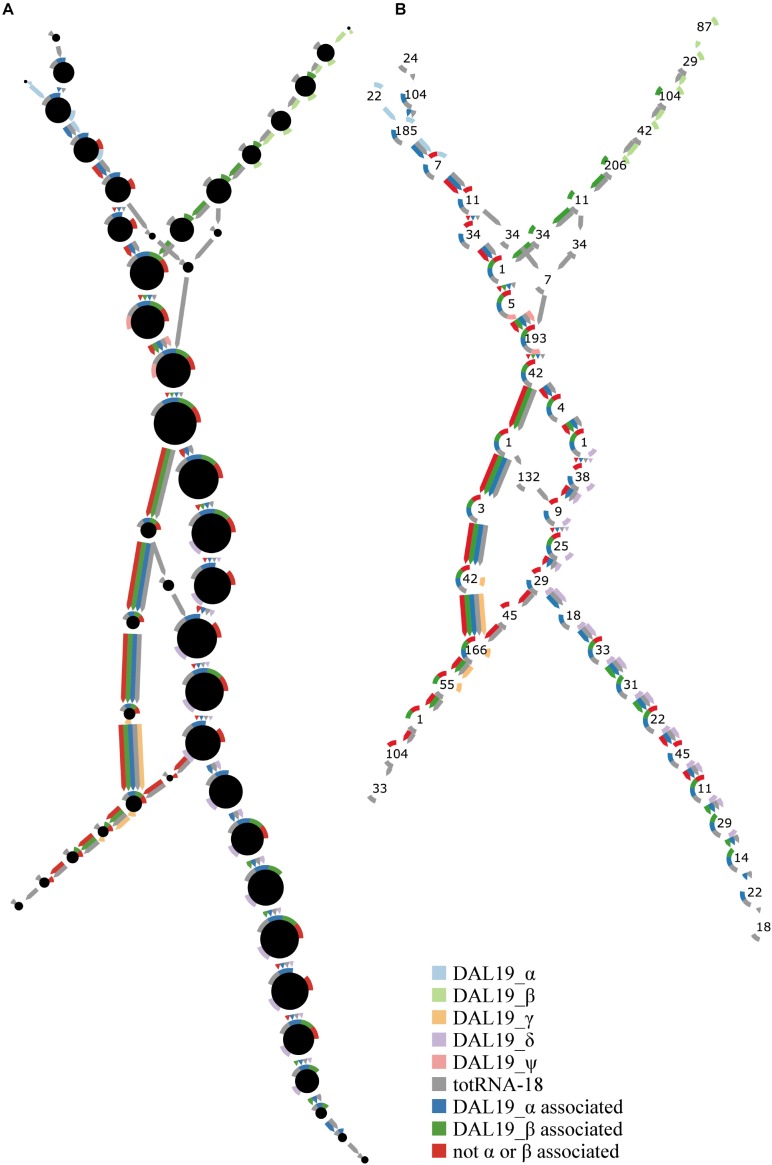
FIGURE 2.
Complete traversal of final Cortex graph using all colors and starting from the first 47-mer of DAL19_ψ. (A,B) Represent the same graph topology. Colors represent different sources of sequencing data as defined in the figure. Circles represent unitigs. The rim of each circle consists of nine circular arcs of equal size representing one of each k-mer color. An arc is colored if the circle’s unitig has non-zero coverage of k-mers in that color. A colored edge connecting circles represents an edge between end k-mers of a unitig in the color of the edge. The first five light colors represent the DAL19 exons α, β, γ, and δ, and the core region ψ (obtained from cloning followed by Sanger sequencing). Gray represents k-mers from short-read RNA-seq data of “totRNA18.” Dark blue represents four CCS reads that map to DAL19_α. Dark green represents four CCS reads that map to DAL19_β. Dark red represents four CCS reads that map to DAL19_ψ, but not the α or β region. (A) The area of the black central circle is proportional to the maximum of the per-color mean coverage of the unitig represented by that circle. (B) The number in the center of each circle is the number of k-mers that constitute the unitig represented by that circle.

