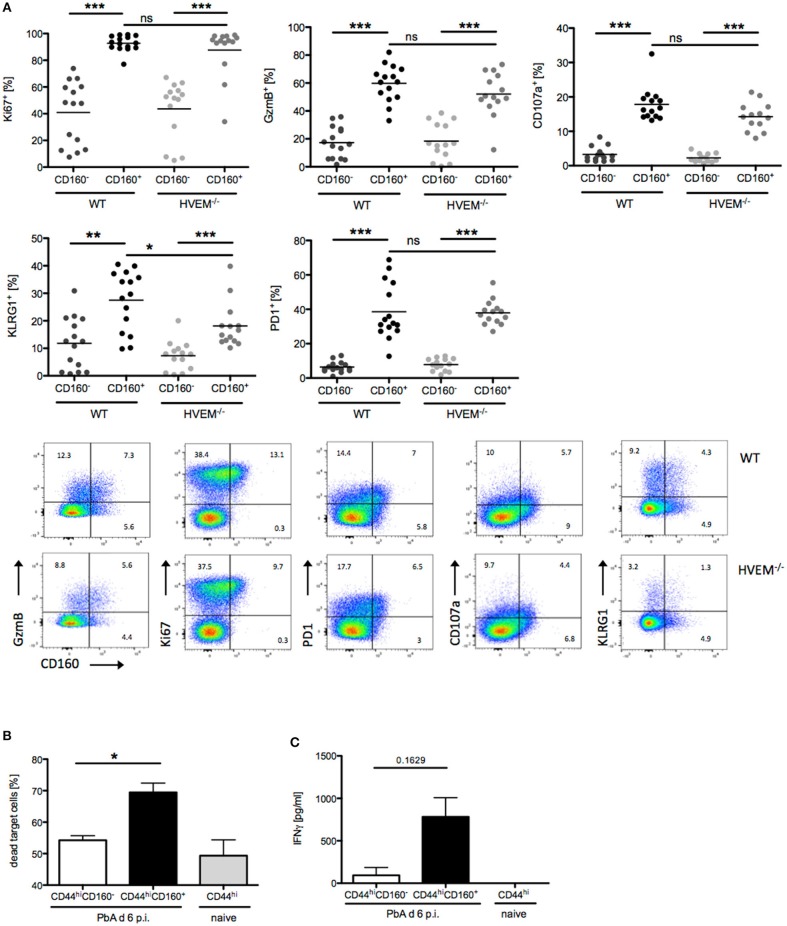
Figure 3.
CD160 characterizes highly activated and cytotoxic CD8+ T cells during malaria. (A) Flow cytometric analysis of CD160+/−CD8+ T cells isolated from the spleen at d 6 p.i. Data were pooled from 3 independent experiments including 3–6 mice/group (total WT n = 14–15, HVEM−/− n = 13–14). Representative plots are shown. *p < 0.05, **p < 0.01, and ***p < 0.001. (B) Flow cytometry based cytotoxicity assay performed on CD8+CD44hiCD160+ and CD8+CD44hiCD160− effector cells FACS sorted from spleens of PbA infected mice at d 6 p.i., and co-cultured with naive splenocytes pulsed with Pb-specific peptides as target cells. Data were pooled from 4 independent experiments, in which a pool of splenocytes from 3–4 mice was used. This means ± SEM are shown. *p = 0.0286 (C) Release of IFNγ by effector cells, isolated as described in (B), after 24 h co-culture with Pb-peptide pulsed Hepa1-6H cells. Pooled data of three independent experiments performed in at least triplicates is shown as means ± SEM.

