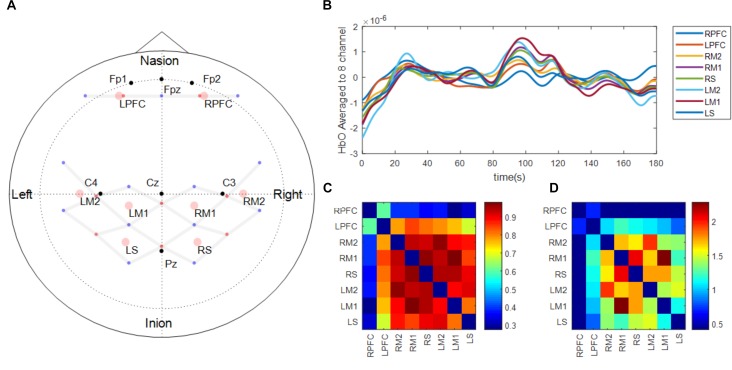
FIGURE 2.
fNIRS probe design (A) and functional connectivity analysis procedure (B–D). Panel (A) shows the location of light emitters (red dots) and detectors (blue dots). Gray lines between optodes depict the location of channels where brain activation is measured. Black dots represent the location of reference points based on 10–20 international EEG system. Pink circles show the location of the regions of interest which are average of surrounding channels. The regions of interest were defined based on the functions of a sensorimotor network of both hemispheres (Prefrontal area: LPFC, RPFC, Medial motor area: LM1, RM1, Lateral motor area: LM2, RM2, and Sensory area: LS, RS). Panel (B) shows an example of the fNIRS time-series signal processed and aggregated to the regions of interest during the early phase of one participant. Panel (C) shows Pearson correlation matrix across the time-series signals shown in Panel (B). Panel (D) shows Fischer’s z-score converted from Panel (C) and only showed the scores of nodes between the two functionally connected regions based on predetermined threshold of 0.4.

