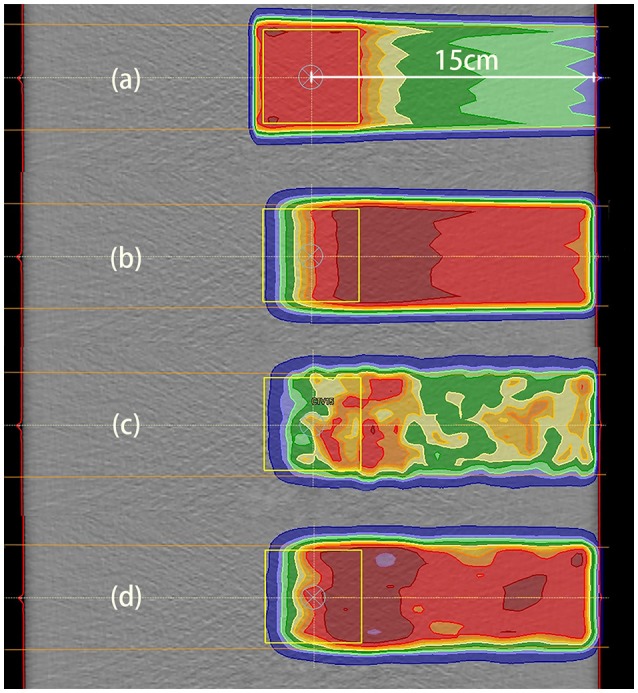
Figure 6.

Data distributions in the 2 Gy case with a depth of 15 cm. (a) Dose distribution, where the dose was designed for uniform distribution throughout the CTV; (b) PET results predicted using PET-RV; (c) original measured PET data; (d) measured PET data after smoothing and normalization. (b,d) have similar ranges and values, which means that the measured data agreed better with the predicted data after smoothing and normalization.
