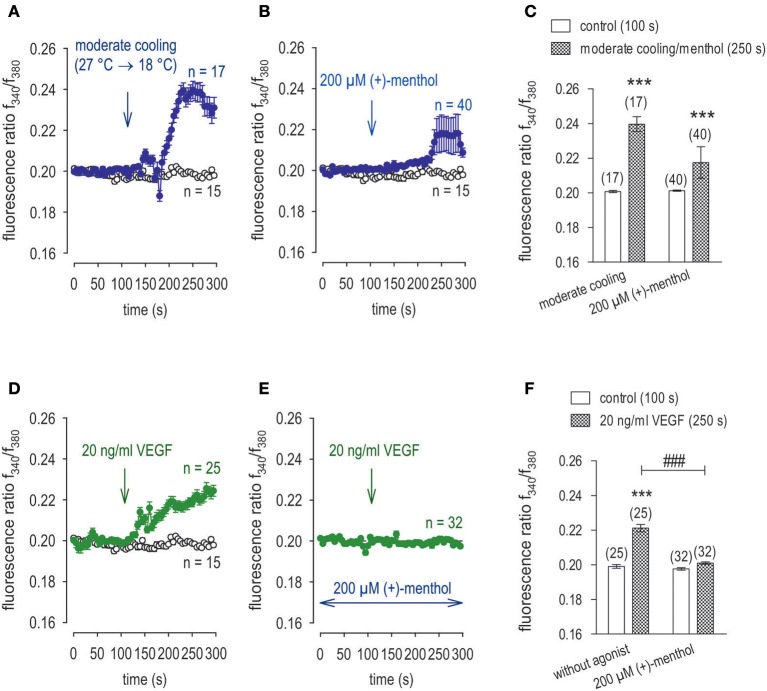
Figure 10.
Menthol suppressed VEGF-induced Ca2+ increase in UM 92.1 cells. Drugs were added at the indicated time points (arrows). Data are mean ± SEM of 15–40 Ca2+ traces in each set of experiments. (A) Moderate cooling (≈27 to 18°C) induced a Ca2+ increase, which partially recovered (n = 17). Non-treated control cells showed a constant Ca2+ baseline (n = 15). (B) TRPM8 activation by menthol (200 μM) led to a Ca2+ increase, which is at lower levels compared to moderate cooling (n = 40). (C) Summary of the experiments with cooling and menthol. The asterisks (*) show significant Ca2+ increases with moderate cooling and menthol (n = 17 - 40; ***p < 0.005; paired tested). (D) The Mean trace showing VEGF-induced Ca2+ increase (n = 25). (E) Same experiment as shown in (D), but in the presence of menthol (200 μM). Menthol clearly suppressed the VEGF-induced Ca2+ increase (n = 32). (F) Summary of the experiments with VEGF and menthol. The asterisks (*) show significant Ca2+ increases with VEGF (n = 25; ***p < 0.005; paired tested). The hashtags (###) show significant Ca2+ decreases in the presence of menthol (n = 32; ###p < 0.005; unpaired tested).

