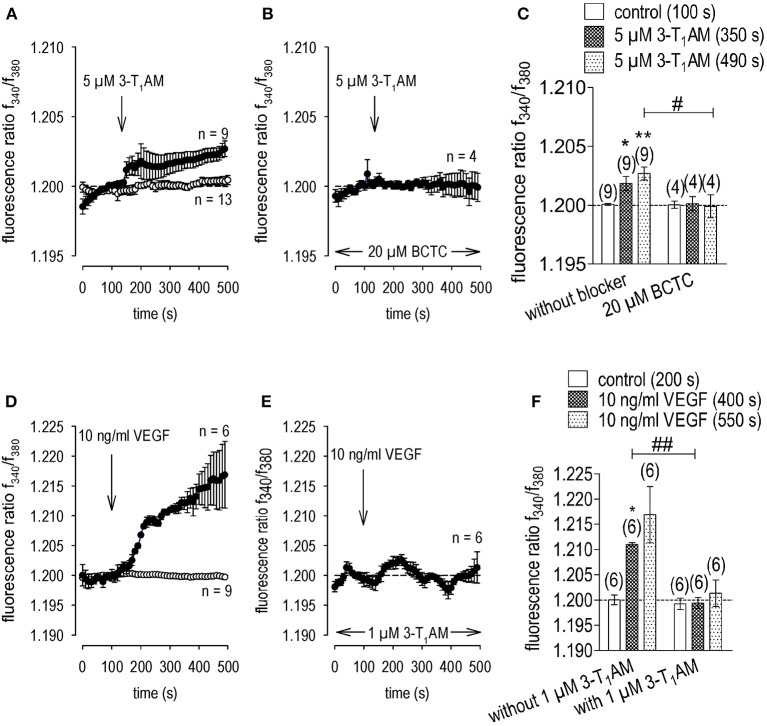
Figure 7.
3-T1AM elicits increases in Ca2+ entry through TRPM8 channels but instead suppresses VEGF-induced Ca2+ increases in UM 92.1 cells. 3-T1AM (5 μM) or VEGF (10 ng/ml) was added at the time points indicated by arrows. Data are mean ± SEM of 4–9 experiments. (A) Mean trace showing 3-T1AM-induced Ca2+ increase (n = 9) whereas non-treated control cells showed a constant Ca2+ baseline (n = 13). (B) Same experiment as shown in (A), but in the presence of BCTC (20 μM). BCTC clearly suppressed the 3-T1AM-induced Ca2+ increase (n = 4). (C) Summary of the experiments with 3-T1AM and BCTC. The asterisks (**) show significant Ca2+ increases with 3-T1AM (n = 9; 350 s; *p < 0.05; 490 s; **p < 0.01; paired tested). The hashtag (#) indicates a statistically significant difference of fluorescence ratios between 3-T1AM with and without BCTC (n = 6; 490s; #p < 0.05; unpaired tested). (D) Mean trace showing VEGF-induced Ca2+ increase (n = 6) whereas non-treated control cells showed a constant Ca2+ baseline (n = 9). (E) Same experiment as shown in (D), but in the presence of 3-T1AM (1 μM). 3-T1AM clearly suppressed the VEGF-induced Ca2+ increase (n = 6). (F) Summary of the experiments with VEGF and 3-T1AM. The asterisk (*) shows a significant Ca2+ increase with VEGF (n = 6; 400 s; *p < 0.05; paired tested). The hashtags (##) indicate statistically significant differences of fluorescence ratios between VEGF with and without 3-T1AM (n = 6; 400 s; ##p < 0.01; unpaired tested).

