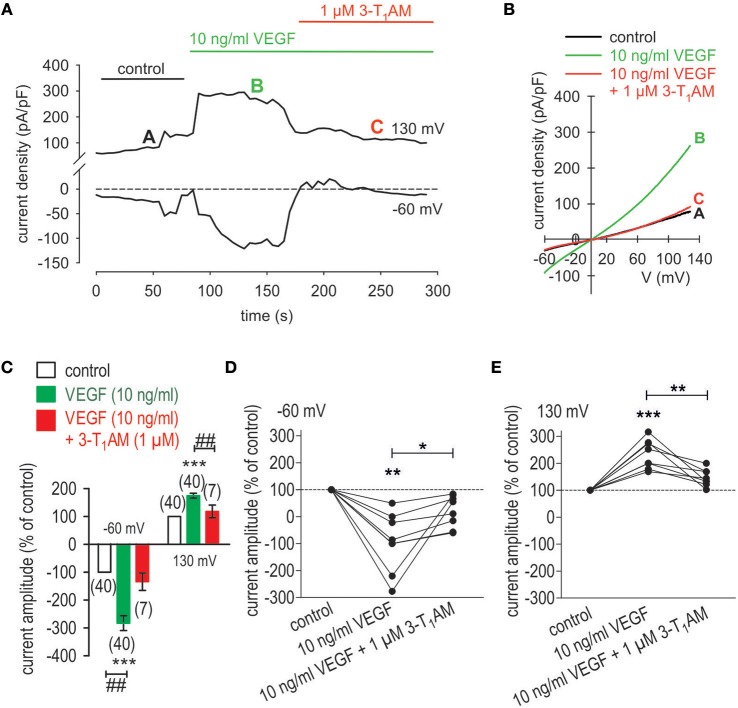
Figure 8.
3-T1AM suppresses VEGF-induced rises in whole-cell currents in UM 92.1 cells. (A) Time course recording showing the current increases induced by VEGF (10 ng/ml) and reduction after application of 10 μM 3-T1AM. (B) Original traces of VEGF-induced current responses to voltage ramps. Current densities are shown before application (labeled as A), during application of VEGF (labeled as B), and after addition of 3-T1AM (labeled as C). Current densities as function of voltage were derived from the traces shown in panel A. (C) Summary of patch-clamp experiments with VEGF and 3-T1AM. The asterisks (***) indicate statistically significant increase with VEGF (n = 40; ***p < 0.005; paired tested). The hashtags (##) indicate statistically significant differences of whole-cell in- and outward currents between VEGF with and without 3-T1AM (n = 7–40; ##p < 0.01; unpaired tested). (D) Maximal negative current amplitudes induced by a voltage step from 0 to −60 mV are depicted in percent of control values before application of 10 ng/ml VEGF. VEGF-induced inward currents (n = 7; **p < 0.01) were clearly suppressed in the presence of 1 μM 3-T1AM (n = 7; *p < 0.05). (E) Maximal positive current amplitudes induced by a voltage step from 0 to +130 mV are depicted in percent of control values before application of 10 ng/ml VEGF. VEGF-induced outwardly rectifying currents (n = 7; ***p < 0.005) were clearly suppressed in the presence of 1 μM 3-T1AM (n = 7; **p < 0.01).

