Figure 9.
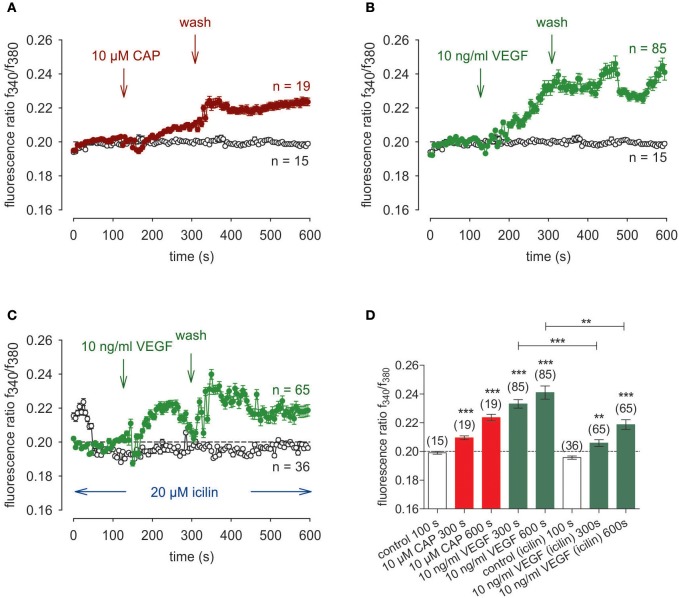
Icilin suppressed VEGF-induced Ca2+ increase in UM 92.1 cells. Drugs were added at the indicated time points (arrows). Data are mean ± SEM of 15–85 Ca2+ traces in each set of experiments. (A) CAP (10 μM) induced an irreversible Ca2+ increase (n = 19). A washout did not reduce the Ca2+ levels. Non-treated control cells showed a constant Ca2+ baseline (n = 15). (B) The similar Ca2+ response pattern could be observed with 10 ng/ml VEGF instead of CAP (n = 85). (C) Same experiment as shown in (B), but in the presence of icilin (10 μM) (n = 65). Icilin partially suppressed the VEGF-induced Ca2+ increase (n = 65). Non-treated control cells showed a constant Ca2+ baseline in the presence of icilin (n = 36). (D) Summary of the experiments with CAP, VEGF and icilin. The asterisks (***) show significant Ca2+ increases with CAP and VEGF (n = 15–85; **p < 0.01 at the minimum; unpaired tested).

