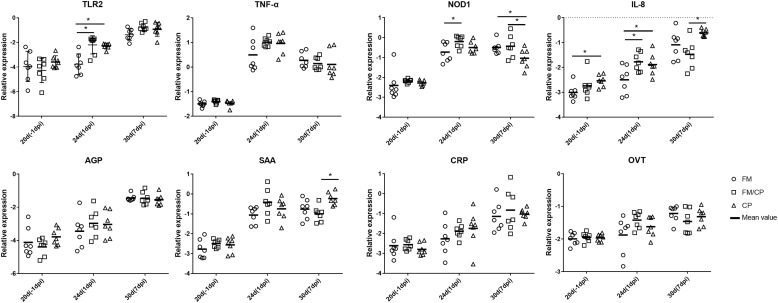
FIGURE 4.
Relative change in expression of immune genes in ileum tissue. Relative gene expression represented as log10. Significant difference among three groups are indicated by an asterisk (ANOVA, ∗p < 0.05) for the expression of each genes at the corresponding time point. The Ct values of PIT54 in three groups was below the detection level. IL, interleukin; TNF-α, tumor necrosis factor α; TLR, toll-like receptor; NOD, nucleotide-binding oligomerization domain; AGP, alpha 1- acid glycoprotein; SAA, serum amyloid A; CRP, C- reactive protein; OVT, ovotransferrin; dpi, day post-infection.

