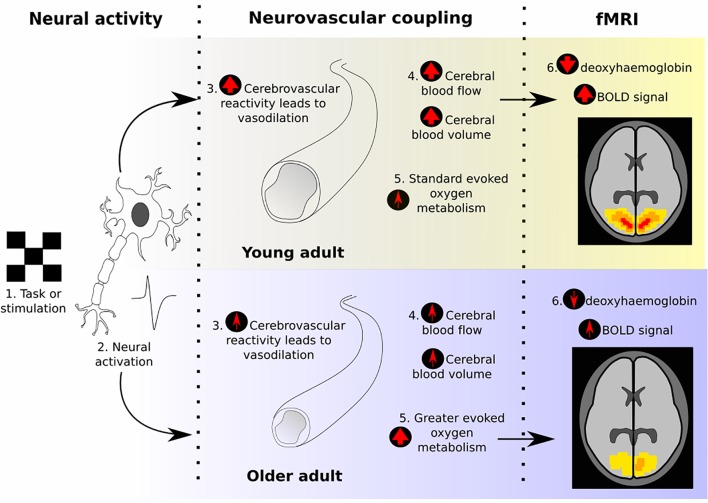
FIGURE 1.
Illustration of the neurovascular coupling processes that give rise to the BOLD response, and how these typically change between young and old adults, according to previous literature. The final “fMRI” section demonstrates what effect would be expected on the BOLD response due to these age-related changes, assuming equal neural activity.

