
FIGURE 3.
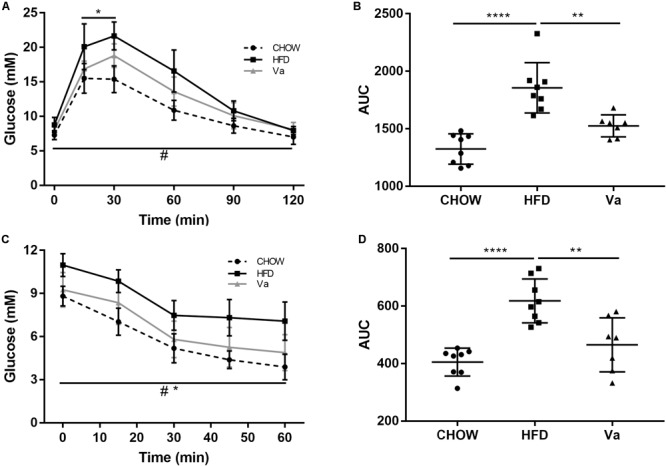
Vanillin alleviates the glucose intolerance and IR of the mice related to obesity. (A,C) The changes in blood glucose concentrations during GTT (A) and ITT (C). ∗P < 0.05, CHOW compared to HFD group; #P < 0.05, Va compared to HFD group. (B,D) The area under the curves (AUC) of (A,C), respectively. ∗∗P < 0.01 and ∗∗∗∗P < 0.0001.