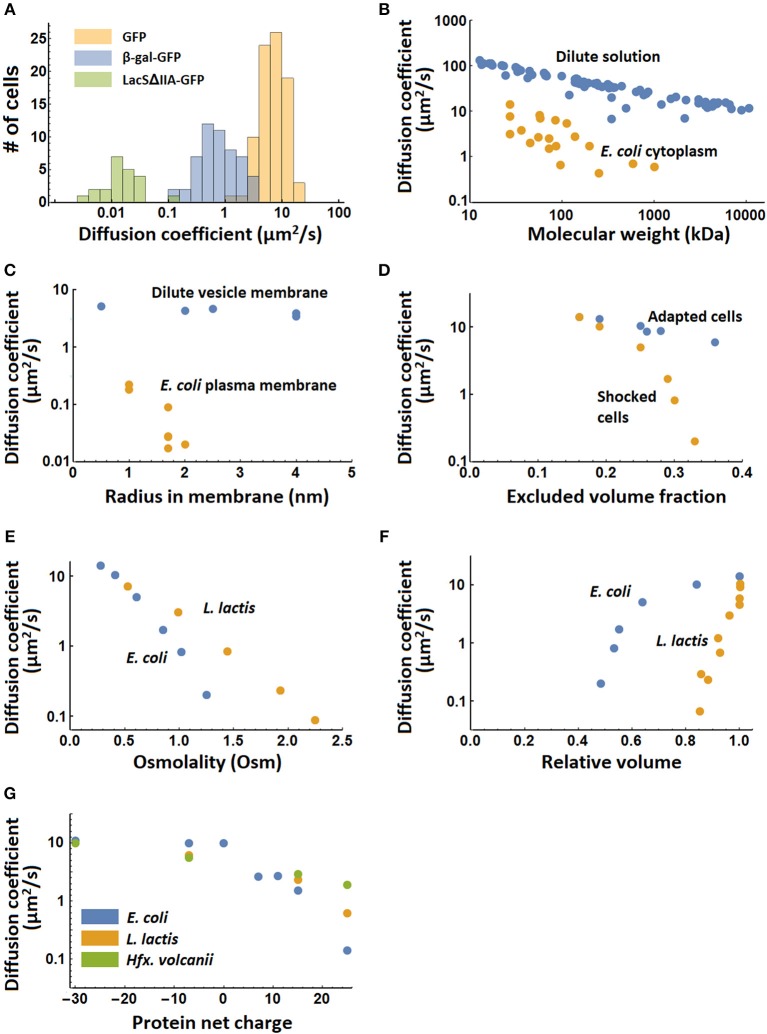
Figure 3.
Systematic variation of diffusion coefficients with protein and environment properties. (A) Variation of diffusion coefficient within a population of cells for the proteins GFP and β-galactosidase-GFP (tetramer) in the cytoplasm, and LacSΔIIA-GFP in the membrane of Lactococcus lactis (Mika et al., 2014). (B) The dependence of diffusion coefficient on molecular weight in dilute solution (Tyn and Gusek, 1990) and the Escherichia coli cytoplasm (Elowitz et al., 1999; van den Bogaart et al., 2007; Konopka et al., 2009; Kumar et al., 2010; Mika et al., 2010; Nenninger et al., 2010; Bakshi et al., 2012). (C) The dependence of diffusion coefficient on radius of the membrane spanning part of membrane proteins in giant unilamellar vesicles (GUVs) (Ramadurai et al., 2009) and in the Escherichia coli plasma membrane (Kumar et al., 2010). The radii for the proteins studied in the E. coli membrane are calculated from the number of transmembrane helices (Kumar et al., 2010) and the radius of a single helix peptide reported in (Ramadurai et al., 2009). (D) The dependence of diffusion coefficient of cytoplasmic GFP on excluded volume fraction in adapted and shocked Escherichia coli cells (Konopka et al., 2009). (E) The dependence of the diffusion coefficient of cytoplasmic GFP on medium osmolality after osmotic shock for Escherichia coli and Lactococcus lactis (Konopka et al., 2009; Mika et al., 2014). The growth medium had the same osmolality as the first points on the graph. (F) The dependence of the diffusion coefficient of cytoplasmic GFP on the relative cell volume after osmotic shock in Escherichia coli and L. lactis (Mika et al., 2014). (G) The dependence of the cytoplasmic diffusion coefficient of GFP variants on their net charge in Escherichia coli, Lactococcus lactis and Haloferax volcanii (Schavemaker et al., 2017). There is no data for −30 GFP in L. lactis.

