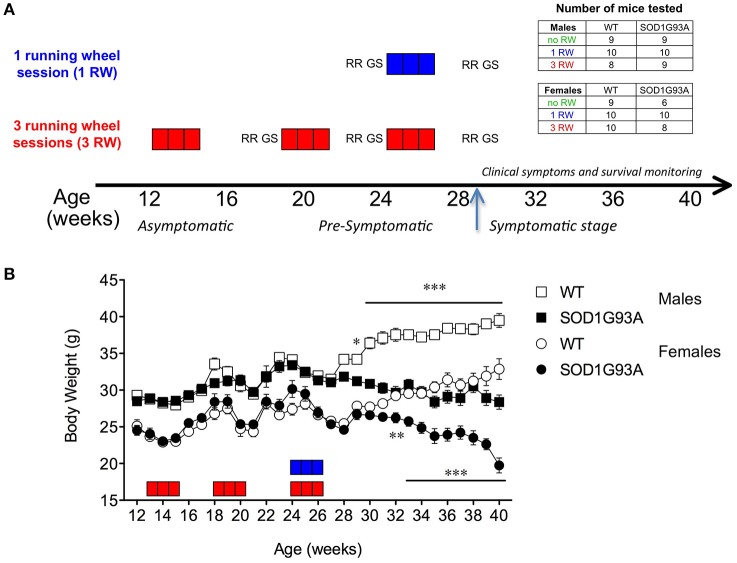
Figure 1.
Experimental design and body weight. (A) Experimental design: Each square box represents 1 week of running wheel (RW) exposure: in blue, group 1 RW; in red, group 3 RW. Each three squares/weeks is one session. RR, Rotarod test; GS, grip strength test. Arrow indicates appearance of disease symptoms and beginning of health and survival daily monitoring. Inset: Tables indicate the number of mice tested in each experimental group. (B) Body weight curve in grams of male and female SOD1G93A low-copy and WT littermates across experimental window (12–40 weeks of age). Number of animals varied along the study. Age 12–18 weeks (3 RW only): n = 8–10 per sex/genotype; Age 19–30 weeks: n = 23–29 per sex/genotype; Age 30–40 weeks: WT n = 26–29 per sex, SOD1G93A n = 6–20 per sex depending on survival. Asterisks indicate statistically significant differences between WT and transgenic mice in each sex group. *P < 0.05, **P < 0.01, ***P < 0.001.

