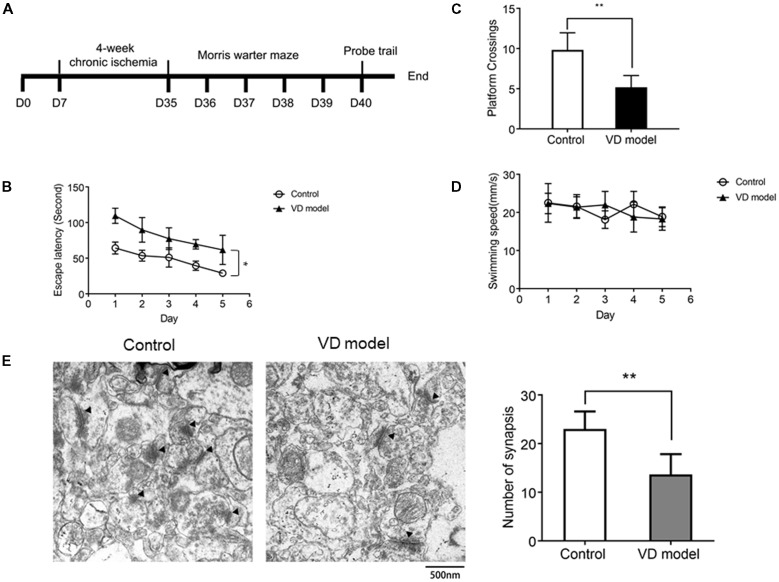
Figure 1.
Chronic ischemic rat model exhibits the decline of spatial learning capability (n = 13/group) and synapse loss in the hippocampus relative to control group (n = 6/group). (A) The timeline of animal experiment. (B) The escape latency of individual rats was processed by a Morris water maze that lasts for 5 days (four times per day). (C) The number of platform crossings measured within 120 s. (D) The motor function was assessed by the swimming speed. (E) Synapses were indicated with black triangles; bar chart showed the number of synapses. Data are shown as mean ± standard deviation (SD) values, and statistical significance between both groups is defined as *p < 0.05; **p < 0.01.

