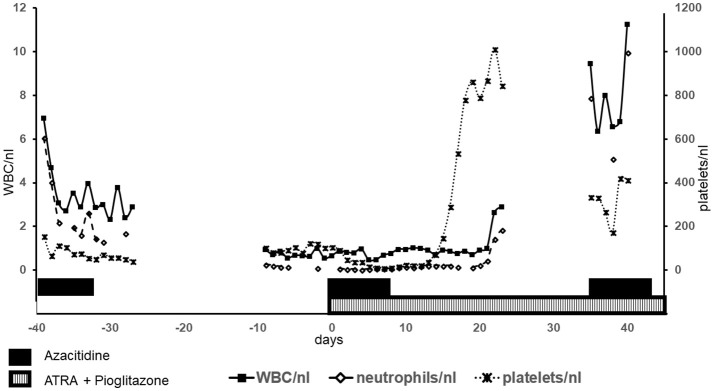
Figure 2.
Blood counts: Blood counts of leukocytes (WBC), neutrophils and platelets are shown. Left y-axis shows values for WBC und neutrophils, right y-axis for platelets. The shown time period comprises the first cycle azacitidine as well as the first cycle of biomodulatory therapy (day 0 = begin of biomodulatory therapy).

