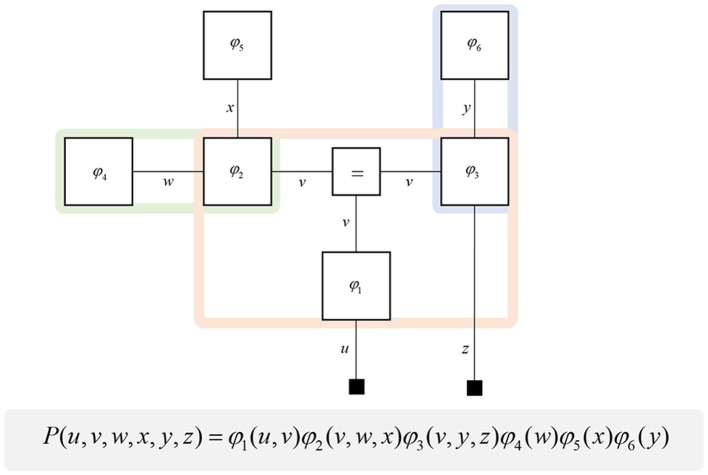
Figure 1.
Forney factor graphs. The graphical model in this figure represents the (arbitrary) probability distribution shown below. Crucially, this distribution can be represented as the product of factors (ϕ) that represent prior and conditional distributions. By assigning each factor a square node, and connecting those factors that share random variables, we construct a graphical representation of the joint probability distribution. The “ = ” node enforces equality on all edges (lines) that connect to it. Small black squares represent observable data. This figure additionally illustrates a simple method for determining the Markov blanket of a variable (or set of variables). By drawing a line around all of the factor nodes connected to a variable, we find that the edges we intersect represent all of the constituents of the Markov blanket. For example, the green line shows that the blanket of w comprises x and v. The pink line shows the Markov blanket of v, which contains u, w, x, y, and z. The blue line indicates that v and z make up the blanket of y.

