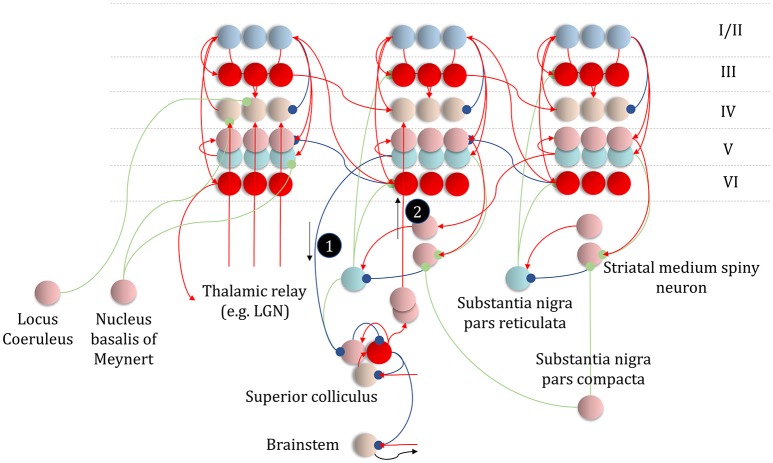
Figure 11.
An anatomy of inference. This schematic summarizes the networks we have discussed so far, but adds in the messages of Figure 10, with empirical priors propagated by message 1. These are subtracted from expectation neurons to give error signals, then used to update expectations. Expectations are used to derive predictions about sensory data. These are subtracted from the incoming data to calculate sensory errors, used to update current expectations, but also to drive brainstem reflexes through action (black arrow) to change sensory data (e.g., by moving the eyes). Message 2 derives from the expectations, which are used to compute the integral of the free energy over time. The relative evidence for each outcome is then propagated to layer IV cells in the cortex, acting as if it were sensory data. As before, the layers of the cortical microcircuit shown here represent beliefs about states under a given policy (I/II), beliefs about states averaged over policies (III), state prediction errors (IV), expected free energy gradients and predicted outcomes (V), and beliefs about states averaged over policies (VI).

