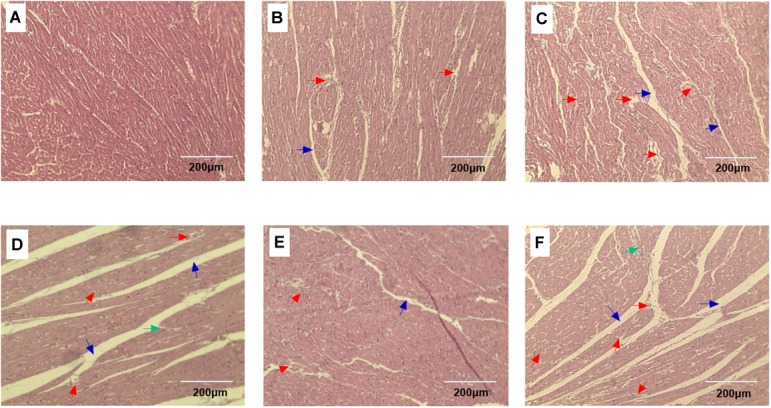
FIGURE 2.

HE stained heart tissue sections of broiler after pre-ACS and ACS treatment. (A–C) Represent the C, CS I, and CS II groups at pre-ACS. (D–F) Represent the C, CS I, and CS II groups at ACS, respectively. (HE, ×200). Red arrows: disordered or ruptured cardiac muscle fiber arrangement. Green arrows: inflammatory cell infiltration. Black arrows: interstitial space.
