
FIGURE 3.
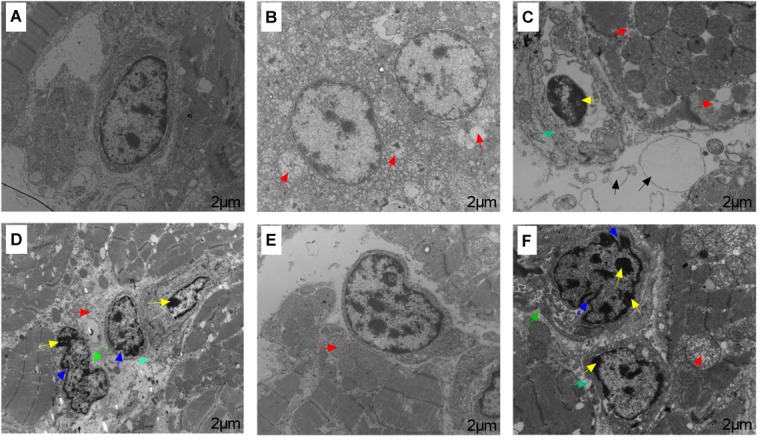
Transmission electron microscopy results of broiler heart tissues from C, CS I, and CS II groups after pre-ACS and ACS treatment. (A–C) Represent the C, CS I, and CS II groups at pre-ACS. (D–F) Represent the C, CS I, and CS II groups at ACS, respectively. Red arrows: slightly mitochondrial cristae disappearance, mitochondrial vacuoles and swelling. Yellow arrows: chromatin aggregation in the nuclear membrane and nuclear pore. Blue arrows: nuclear shrinkage. Green arrows: cytomembrane sinking. Black arrows: vacuolation of the cytoplasmic reticulum and edema. Magnification: 10,000×.