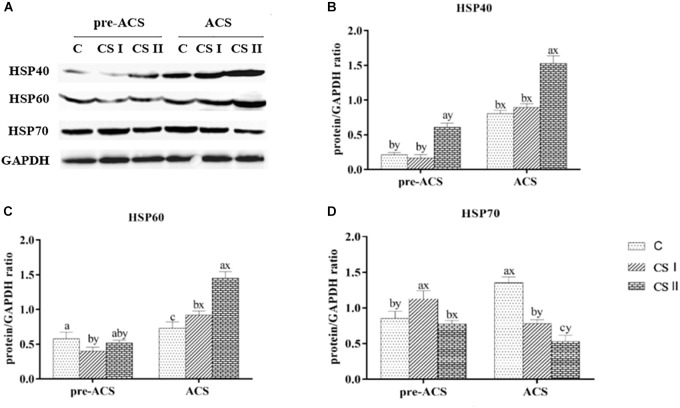
FIGURE 5.
(A) Protein bands of HSPs and GAPDH. (B–D) Expression levels of HSP40, HSP60, and HSP70 proteins in broiler hearts at pre-ACS and ACS. a,b,cMeans with different superscripts represent significant differences between groups at same time (P < 0.05). x,yMeans with different superscripts represent significant differences between pre-ACS and ACS in same group (P < 0.05), the same or no superscripts represent no significant differences (P > 0.05).

