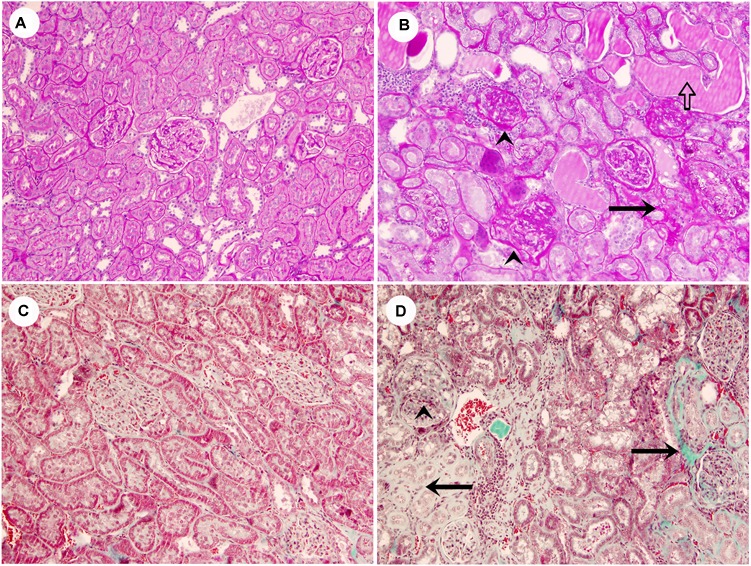
FIGURE 1.

Representative images of lean rats without glomerular or tubulointerstitial injury (A,C), and obese rats with segmental glomerular sclerosis (ˆ), tubular atrophy (black arrows), tubular casts (white arrow) and inflammatory infiltrate (B,D) (A,B, PAS stain; C,D, Masson’s trichrome stain, original magnification 10×).
