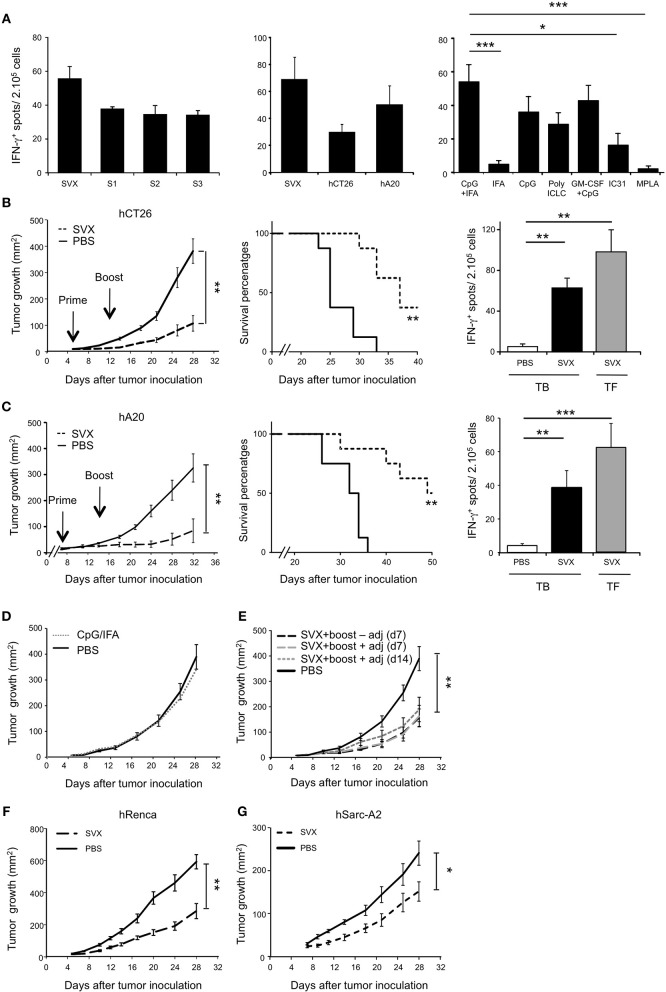
Figure 2.
High therapeutic efficacy of SVX vaccine against various established tumor models. (A) T-cell immunogenicity of SVX vaccine and adjuvant selection. Tumor-free BALB/c (H2d) mice were subcutaneously (s.c) vaccinated as followed: priming with the three survivin LSPs (SVX) and adjuvants and boost 2 weeks later with SVX without adjuvant. One week after the boost, the induction of survivin-specific T-cell responses was analyzed by IFN-γ ELISpot assay on total splenocytes (2 × 10⁵ cells). Left and middle graphs showed overnight restimulation with the pool of SVX peptides or individual peptides (A, left graph) or tumor cell lines expressing the human survivin (hCT26 and hA20) (A, middle graph). Comparison of SVX specific T-cell responses induced by various adjuvants was performed by restimulation with the pool of SVX peptides (A, right graph). Results are the mean ± SEM of 5 mice per group and are representative of two to three independent experiments. ***P < 0.001, *P < 0.05. (B,C) Therapeutic experiments. BALB/c mice were engrafted s.c with hCT26 (2 × 10⁵ cells) (B) or hA20 cells (2.5 × 10⁵ cells) (C). When tumors reached 10 mm2, mice were s.c injected with PBS, or immunized with SVX + CpG/IFA and received a boost 1 week later without adjuvant (SVX). (B,C) (Left graphs). Tumor growth was monitored twice a week and data are presented as mean tumor size (mm2) ± SEM. **P < 0.01. (Middle graphs). Kaplan-Meier survival curves of mice treated (dashed line) or not (black line) with SVX vaccine. The experimental endpoint was applied when tumor size reached 300 mm2. (Right Graphs). Intensity of SVX specific T-cell responses in the different groups: Tumor-bearing (TB) mice injected with PBS, or vaccinated (SVX) and Tumor-free (TF) mice immunized with SVX vaccine. Data are presented as means of IFN-γ spots ± SEM in the different groups of mice. **P < 0.01, ***P < 0.001. Data are representative of the results obtained in five separate experiments with 8 mice per group. (D,E) Control studies in the hCT26 tumor model. (D) Impact of the adjuvant on tumor growth. When tumors reached 10 mm2, mice were injected with PBS (PBS), or injected with the adjuvant alone (CpG/IFA). Data represent the mean of tumor size (mm2) ± SEM. (E) Impact of the vaccination strategy at boost on the vaccine efficacy. BALB/c mice were engrafted s.c with hCT26 tumor cells and injected with PBS (PBS), or vaccinated as followed: boost at d7 without adjuvant, at d7 with SVX + adjuvant or at d14 with SVX + adjuvant. Tumor growth was monitored every 2–3 days and data are presented as mean tumor size (mm2) ± SEM. The experiment has been repeated two-three times with similar results. **P < 0.01. (F,G) BALB/c mice engrafted s.c with hRenca (5 × 10⁵ cells) (F) or humanized HLA-A2/DR1 transgenic mice engrafted s.c with hSarc-A2 (5 × 10⁵ cells) tumor cells (G) were s.c injected with PBS or vaccinated with SVX + CpG/IFA and boosted 1 week later with SVX (SVX). Data are presented as mean tumor size (mm2) ± SEM and is representative of one out of two independent experiments with 8 mice per group. *P < 0.05, **P < 0.01.

