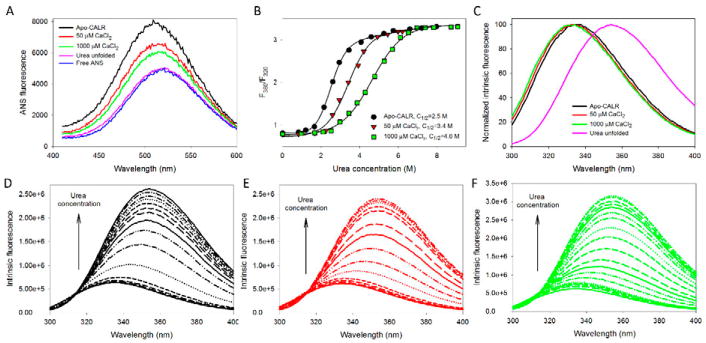
Figure 2. Analysis of the effect of calcium on structural properties and conformational stability of the full-length human CALR. The following buffers were used in these spectroscopic studies: 2mM HEPES, 200mM NaCl, pH=7.0 supplemented with either 2mM EDTA (Apo), 50μM CaCl2, or 1000μM CaCl2.
A. ANS fluorescence spectra measured for the full-length human CALR in the absence calcium (black line) or in the presence of 50μM CaCl2 (red line), or 1000μM CaCl2 (green line). Spectra of free ANS (blue line) and CALR completely unfolded by 8M urea (pink line) are shown for comparison. In these experiments, protein concentration was 0.01mg/mL, and ANS concentration was kept at the level of 10μM.
B. Urea-induced unfolding of the apo-form of the full-length human CALR (black circles) and the CALR in the presence of 50μM CaCl2 (red triangles), or 1000μM CaCl2 (green squares). Urea-induced unfolding was detected by the characteristic red shift of the intrinsic fluorescence spectrum monitored by the urea-induced changes in the F360/F320 values, where F360 and F320 correspond to the fluorescence intensity at 360 and 320nm, respectively. Experiments were performed in triplicate. Plots represents averaged F360/F320 values. Conformational stability of the full-length protein is progressively increased with the increase in calcium concentration.
C. Normalized intrinsic fluorescence spectra of the full-length CALR in the absence calcium (black line) or in the presence of 50μM CaCl2 (red line), or 1000μM CaCl2 (green line), and CALR completely unfolded by 8M urea (pink line). Spectra were normalized, since there is a dramatic increase in their maximal intensity which makes the visual analysis of their position difficult.
D. Effect of the increasing urea concentration on the intrinsic fluorescence spectrum of the apo-CALR. Spectra were measured in the presence of 0.0, 0.82, 1.20, 1.65, 2.15, 2.61, 2.94, 3.44, 4.07, 4.59, 5.25, 5.73, 6.59, 7.21, and 7.97 M urea. Increase in urea concentration causes red shift and increase in fluorescence intensity.
E. Effect of the increasing urea concentration on the intrinsic fluorescence spectrum of the full-length human CALR in the presence of 50μM CaCl2. Spectra were measured in the presence of 0.00, 0.83, 1.68, 2.25, 2.59, 2.94, 3.41, 3.92, 4.21, 4.91, 5.45, 5.98, 6.21, and 6.49 M urea. Increase in urea concentration causes red shift and increase in fluorescence intensity.
F. Effect of the increasing urea concentration on the intrinsic fluorescence spectrum of the full-length human CALR in the presence of 1000μM CaCl2. Spectra were measured in the presence of 0.00, 0.97, 1.68, 2.10, 2.52, 2.98, 3.44, 3.87, 4.28, 4.78, 5.27, 5.69, 6.10, 6.53, 6.96, 7.39, 7.83, 8.73, and 9.07 M urea. Increase in urea concentration causes red shift and increase in fluorescence intensity.

