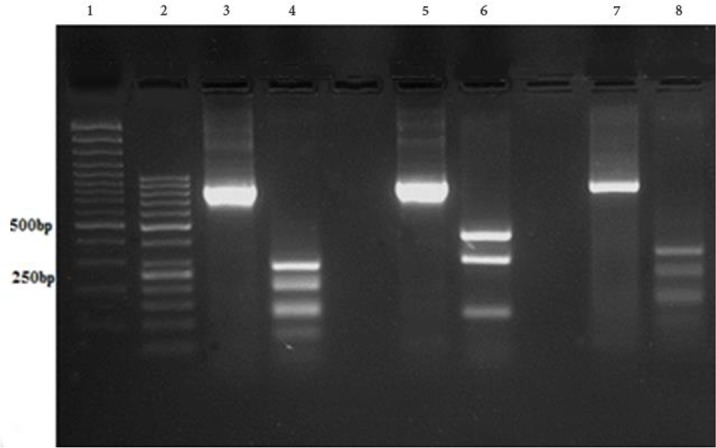
Fig. 3:

Agarose gel electrophoresis, showing PCR-RFLP results before (800–860bp) and after digestion with the restriction enzyme TaqI on reference strains. From left to right: Lanes 1 and 2 L: molecular weight markers (100, 50 bp). Lanes 3 and 4: L. tropica; lane 5 and 6: L. major, Lanes 7 and 8: L. infantum.
After digestion by the restriction enzyme TaqI: L. major: 416, 296 and 141 bp.; L. tropica: 276, 193, 129, 115, 68 and 28 bp.; L. infantum: 326, 277, 142, 70 and 33 bp
