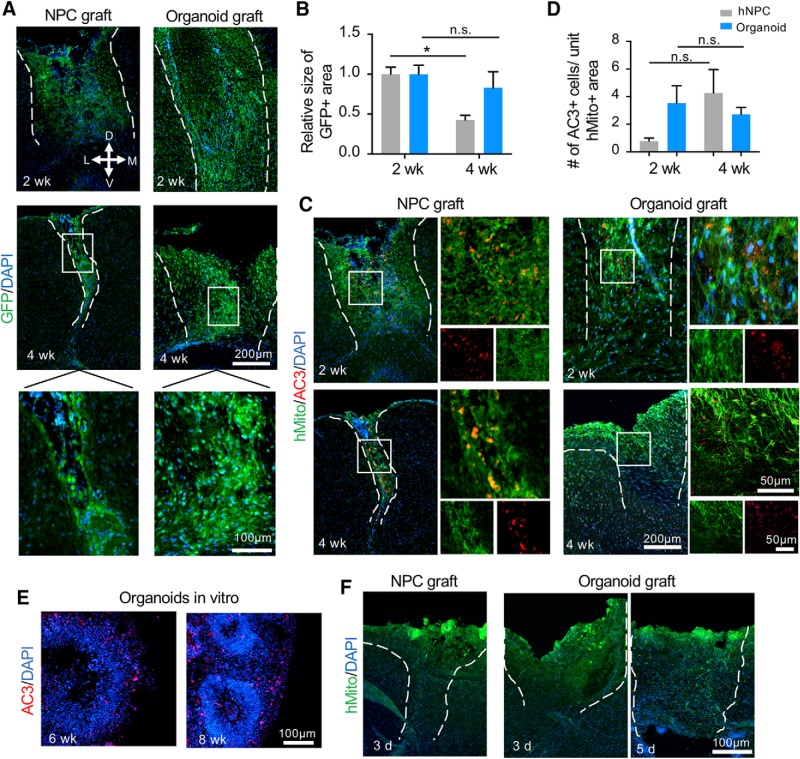
Figure 3.
Engraftment and survival of NPC and cerebral organoid transplants. A, Representative immunofluorescence images of NPC transplant (left) and cerebral organoid transplant (right) at the indicated time points post-grafting. Enlarged images of the boxed area are shown at the bottom. D: dorsal, V: ventral, M: medial, L: lateral. B, Quantification showing the relative size of GFP-positive area of NPC and organoid transplants at two and four weeks after grafting. A significant decrease of the graft size of the NPC transplants was detected at four weeks as compared to two weeks after grafting. C, Representative immunofluorescence images for hMito (human mitochondria) and AC3 in NPC transplants (left) or in cerebral organoid transplants (right) at the indicated time points after transplantation. D, Quantification showing the number of AC3-positive apoptotic cells per unit area of hMito-positive grafts at the indicated time points. E, Representative immunofluorescence images showing a high number of apoptotic cells (AC3+) in stage-matched cerebral organoids in culture at six and eight weeks. F, Representative immunofluorescence images of NPC transplant (left) and cerebral organoid grafts (right) 3 or 5 d after transplantation. At these early time points, grafts had not yet been firmly integrated into host brains. Dashed white lines delineate the graft areas; *p < 0.05; n.s., non-statistically significant. Two-way ANOVA followed by a Tukey post hoc test; n = 3 mice for each time point and two images from each mouse.

