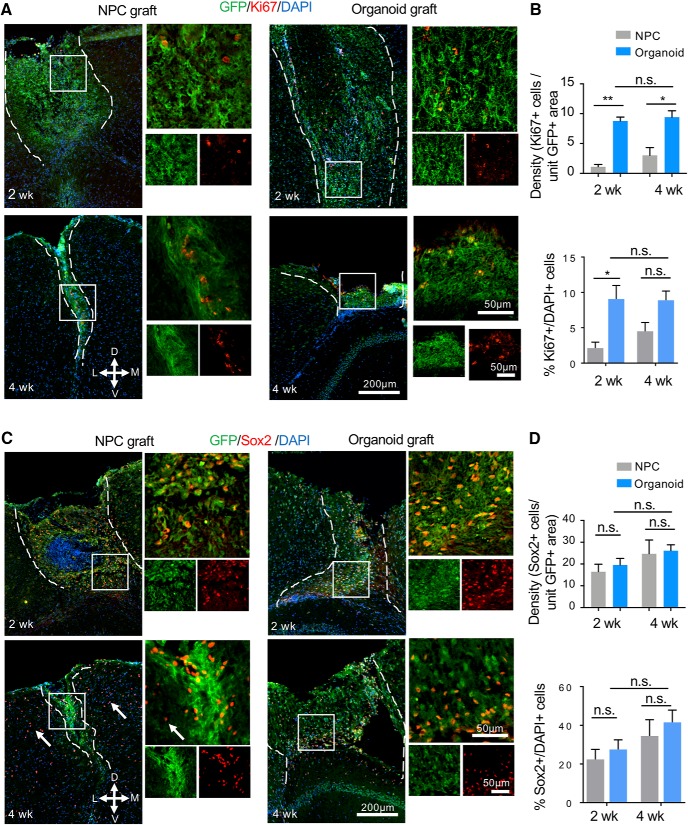
Figure 6.
Cell proliferation and NSC pool in cerebral organoid transplants. A, Representative immunofluorescence images of NPC (left panels) and cerebral organoid transplants (right panels) stained for GFP and proliferation marker Ki67. D: dorsal, V: ventral, M: medial, L: lateral. B, Quantification (top) showing a higher density of Ki67+ cells per unit GFP+ area in cerebral organoid than in NPC transplants at both two and four weeks after transplantation. Bottom quantification: percentage of Ki67+/DAPI+ cells within the GFP+ cerebral organoid and NPC grafts. C, Representative immunofluorescence images of NPC (left panels) and cerebral organoid transplants (right panels) showing abundant engrafted cells (GFP+) expressing stem cell marker Sox2 (red). White arrows: Sox2+ OPC in host cortical tissue. D, Quantification (top) showing no significant difference of the density of Sox2+ cells per unit GFP+ area between NPC and cerebral organoid transplants at either time points. Bottom quantification: percentage of Sox2+/DAPI+ cells within the organoid and NPC grafts showing no significant difference between the two types of transplants at either timepoint. Dashed white lines delineate the graft areas. Enlarged images of the boxed area are shown on the right; *p < 0.05. **p < 0.01; n.s., non-statistically significant. Two-way ANOVA followed by a Tukey post hoc test; n = 3 mice for each time point and at least two images from each mouse.

