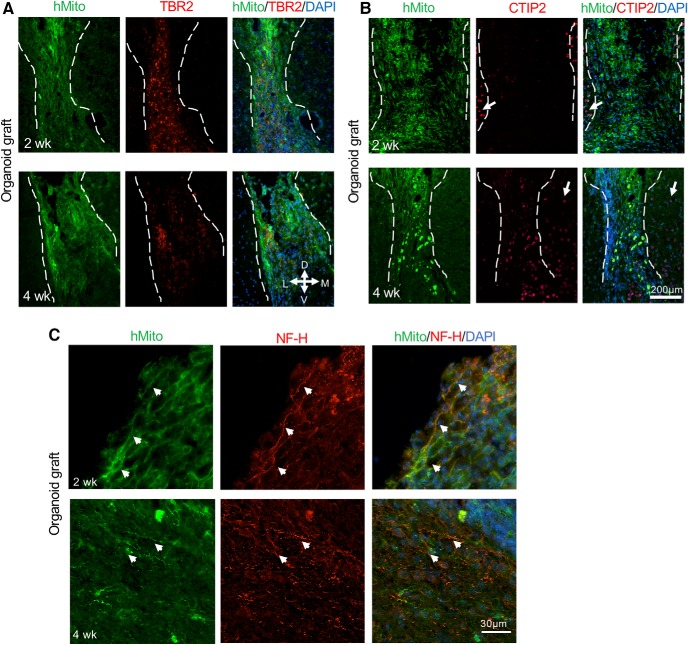
Figure 9.
Differentiation of cerebral organoid transplants. A, Representative immunofluorescence images showing cells expressing intermediate progenitor marker TBR2 in the engrafted cerebral organoids at two and four weeks after transplantation. Notice no TBR2+ cells were observed in host cortical tissue and a slight decline of the number of TBR2+ cells in the hMito+ organoid grafts from two to four weeks after transplantation. B, Representative immunofluorescence images showing cells expressing deep layer neuronal marker CTIP2 in the engrafted cerebral organoids at two and four weeks after transplantation. Notice CTIP2+ cells in neighboring host cortex (white arrows), while in the hMito+ organoid grafts, there was an increase of CTIP2+ cells from two to four weeks after transplantation. C, Representative immunofluorescence images show expression of NF-H in the transplanted organoids after two and four weeks. White arrowheads denote colocalization of NH-H and hMito in organoid transplants. Dashed white lines delineate the graft areas. D: dorsal, V: ventral, M: medial, L: lateral.

