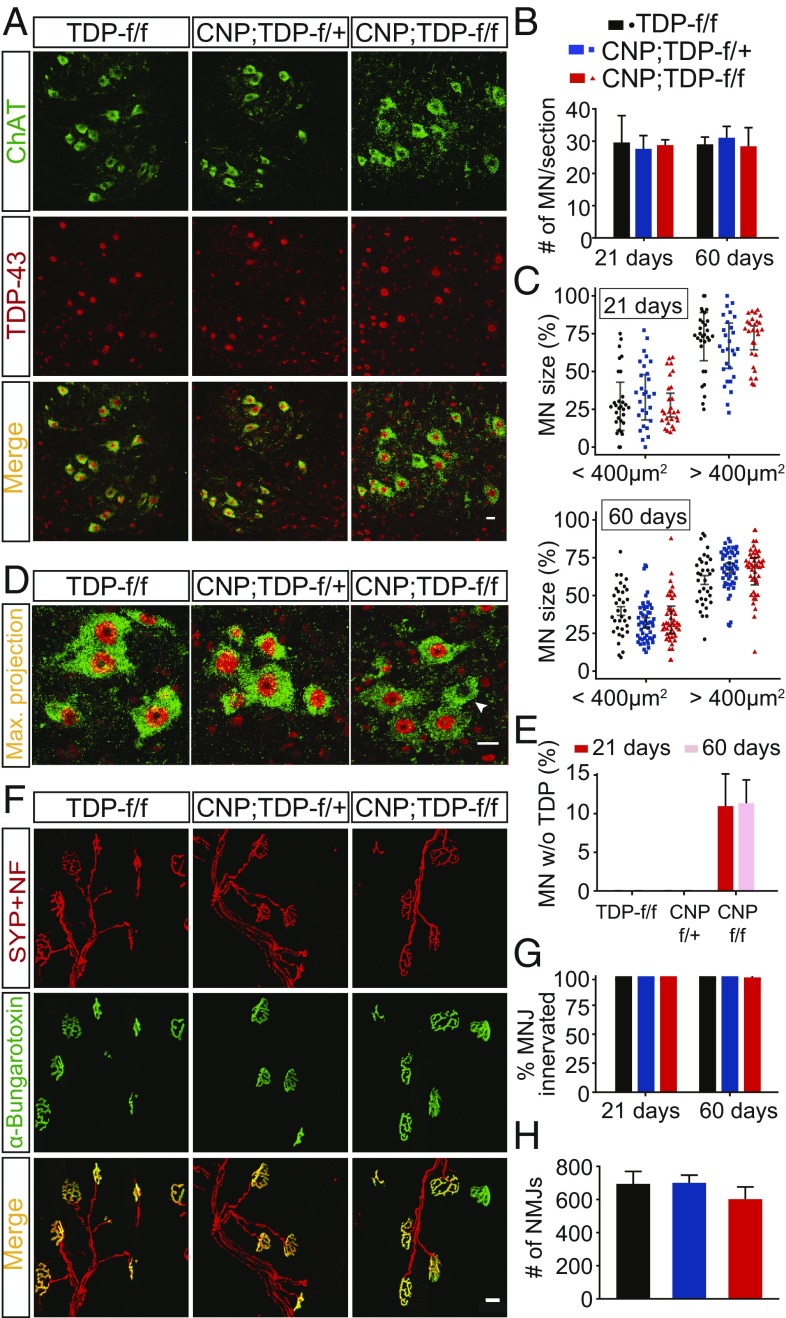
Fig. 7.
No apparent loss of motor neurons and intact NMJs in mice with TDP-43 deleted in oligodendrocytes. (A) Colabeling of motor neurons (ChAT+, green) and TDP-43 (red) among different genotypes at both 21 and 60 d in single plane and z-stack maximum projection images. Loss of TDP-43 can be seen in a small subset of ChAT-positive motor neurons. (Scale bar: 20 μm.) (B) Quantification of motor neurons in the lumbar spinal cords for three genotypes of mice at both 21 and 60 d of age (n = 3 per genotype, n ≥ 7 sections per mouse, for each genotype at each time point). Two-way ANOVA. (C) Quantification of motor neuron size among different genotypes at both time points; 400 μm2 was used to group motor neurons into as either α motor neurons (≥400 μm2) or γ motor neurons (<400 μm2). Linear mixed model. (D) Z-stack and maximum projection of motor neurons (ChAT+, green) and TDP-43 (red) costaining images. Loss of TDP-43 can be seen in a small subset of ChAT-positive motor neurons (arrowhead). (Scale bar: 20 μm.) (E) Quantification of ChAT-positive and TDP-43–negative motor neurons in the spinal cords of TDP-f/f, CNP;TDP-f/+ and CNP;TDP-f/f mice at both 21 and 60 d of age. Approximately 10% of ChAT-positive motor neurons in CNP;TDP-f/f mice lose nuclear TDP-43 staining. One-way ANOVA. (F) Representative images of NMJs of gastrocnemius muscle sections in three genotypes of mice at both 21 and 60 d. Costaining of synaptophysin and neurofilament (red) with α-bungarotoxin (green). (Scale bar: 20 μm.) (G) Percentage of NMJs innervation at both time points. One-way ANOVA. (H) Quantification of total NMJs among three genotypes at 60 d of age. One-way ANOVA.

