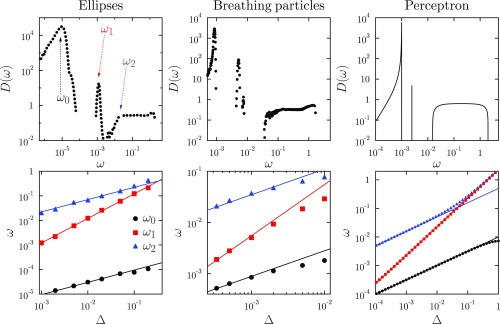
Fig. 2.
Universality of the density of states. (Top) Density of states for ellipses, BP, and the perceptron. (Bottom) Evolution with of the characteristic frequencies at . Solid lines denote the theoretical predictions, , , and , respectively. Data of ellipses are reproduced from ref. 32.

