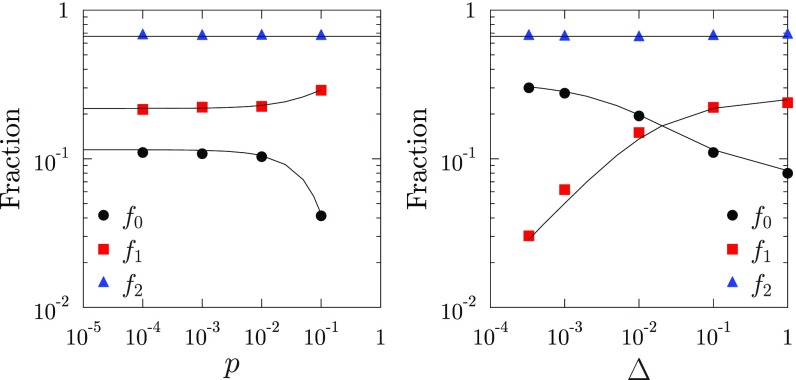
Fig. 3.
Weights of the density of states. Shown is the fraction of modes in the three bands of given in Fig. 2, plotted as functions of at fixed (Left) and at fixed (Right) for BP (with and ). The theoretical predictions , , and are plotted as solid lines, inferred from the measured .

