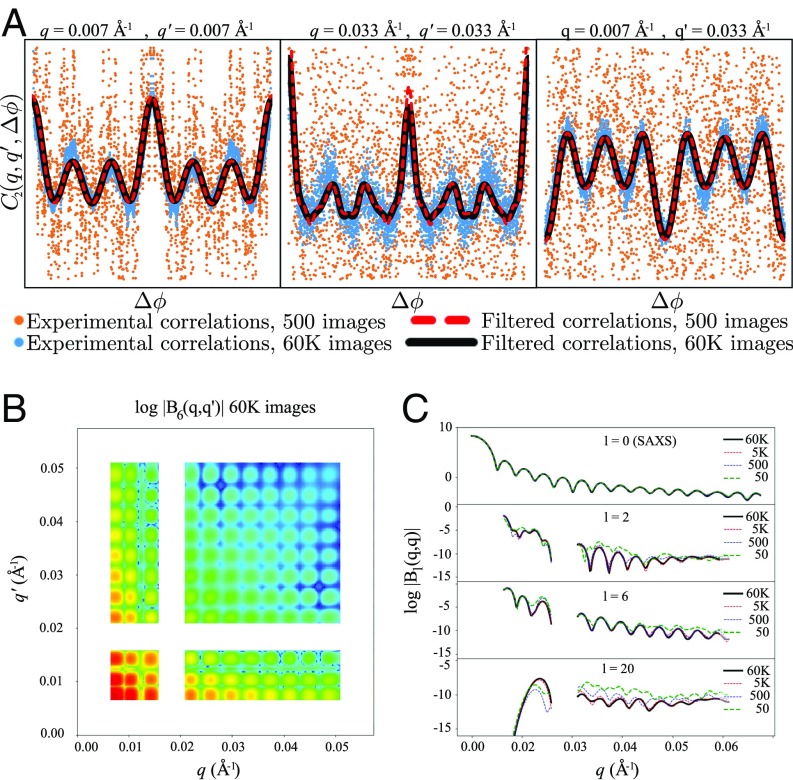
Fig. 2.
The correlations computed from the experimental PBCV-1 correlation data are subjected to the filtering procedure as outlined in detail in Materials and Methods. As can be seen in A, correlations obtained using 60,000 images (blue dots) or those obtained using 5,000 images (orange dots) result in very comparable correlations after the M-TIF technique (red and black lines). (B and C) The surface for obtained from the filtering procedure is shown B, as are the diagonal terms for l equal to 0, 2, 6, and 20 from correlation data derived from various image counts (C). The gaps in the q range of the data (B and C) are regions deemed unreliable due to limited spatial coverage of the detectors in the diffraction setup.

