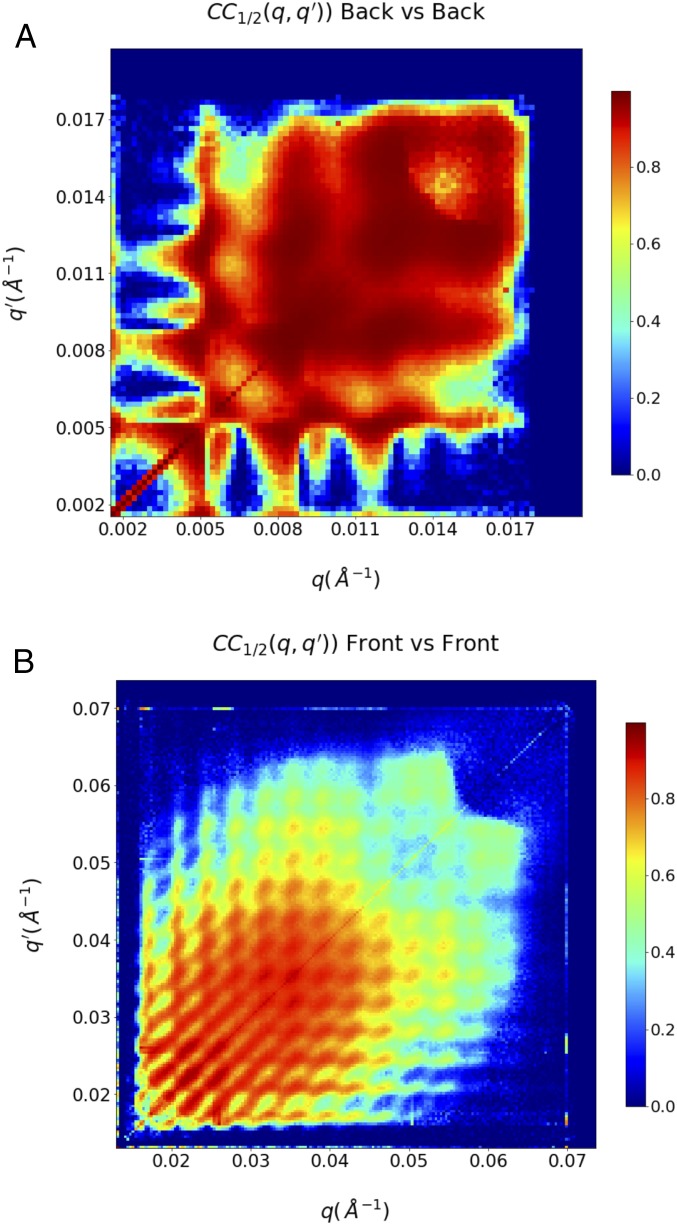
Fig. 4.
Correlation coefficients between two independent data halves collected on the back (A) and the front detector (B) indicate that there are usable data to approximately 0.056 . Data landing between the front and the back panel have not been recorded and have been masked out during the final reconstructions. The very low resolution data have been excluded from the analyses as well, due to the presence of systematic errors in the data. The correlation of the data halves for () pairs falling on different detectors is show in SI Appendix, Fig. S3.

