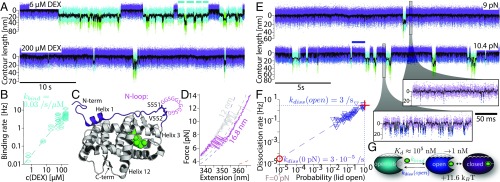
Fig. 2.
Hormone binding and unbinding kinetics are governed by opening and closing of an N-terminal lid. (A) Comparison of contour length vs. time traces at low (6 µM) and high (200 µM) DEX concentrations at constant trap distance (passive-mode). Lid fluctuations between closed (purple) and open (blue) state are interrupted by DEX unbound open-ub (cyan) and partially unfolded (green) phases. Cyan bars in the upper trace mark an example of total dwell time spent in the open-ub state between two closed states. (B) Concentration dependence of the DEX binding rate to the open-ub state. The dashed line is a linear fit. (C) Structure of GR-LBD F602S (PDB ID code 1M2Z). N-terminal 33-aa residues are colored in purple. DEX is colored in green. S551 and V552 are highlighted by stick representation. The loop insertion in the construct is symbolized by GGS in pink. (D) Comparison of force-extension curves obtained from (blue) and (gray) at 200 µM DEX using a constant pulling velocity of 50 nm/s. Dashed colored lines show WLC fits (compare Fig. 1B). (E) Comparison of contour length vs. time traces under two different force biases at 200 µM DEX. The purple bar marks an example for a DEX bound dwell time. (Lower Right) Zooms into the traces. (F) Dependence of dissociation rate on the population probability of the lid open state during the DEX bound phase. Dashed line is a linear fit . Red cross and circle show intersection at and . (G) Pathway for hormone binding.

