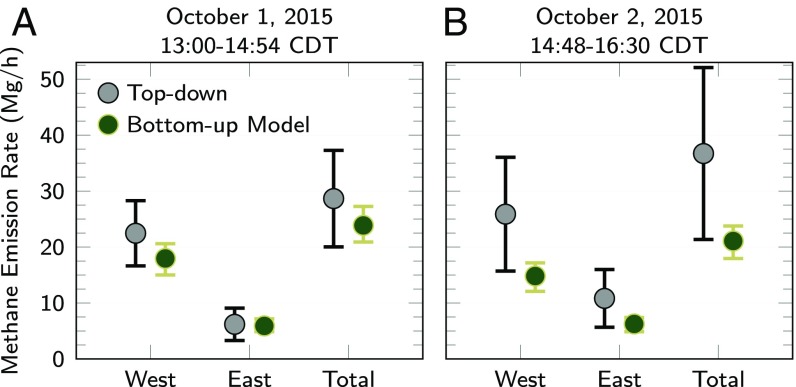
Fig. 3.
Results from the spatially and temporally resolved BU model agree (i.e., 95% CIs overlap, shown by error bars) on two consecutive days for the total study area as well as the eastern and western subportions; A compares aggregate BU to TD emissions during the AMB flight on October 1, and B compares aggregate BU to TD emissions during the flight on October 2. Potential explanations for differences in mean estimates between TD and BU are explored in Discussion.

