Fig. 4.
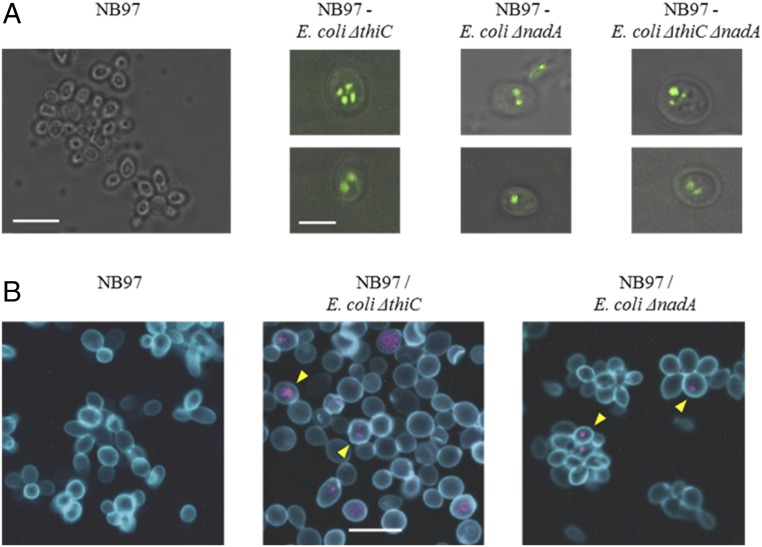
Imaging intracellular endosymbiont E. coli by fluorescent microscopy. (A) TIRF microscopic images of chimeric cells (Right) and control yeast cells (Left). Two representative cells of indicated chimera type are shown. All panels are merged images of TIRF (green) and differential interference contrast (grayscale). (Scale bar in the NB97 panel, 10 µm; scale bar in the NB97–E. coli ΔthiC panel, 5 µm.) (B) Confocal fluorescence microscopy images of control and chimeric yeast–E. coli cells. Yeast cell wall was stained with Con A-FITC (blue) and bacterial rRNA with EUB338-Cy3 probe (purple). Yellow arrowheads indicate examples of EUB338-positive yeast cells. (Scale bar in the Middle, 10 µm.)

