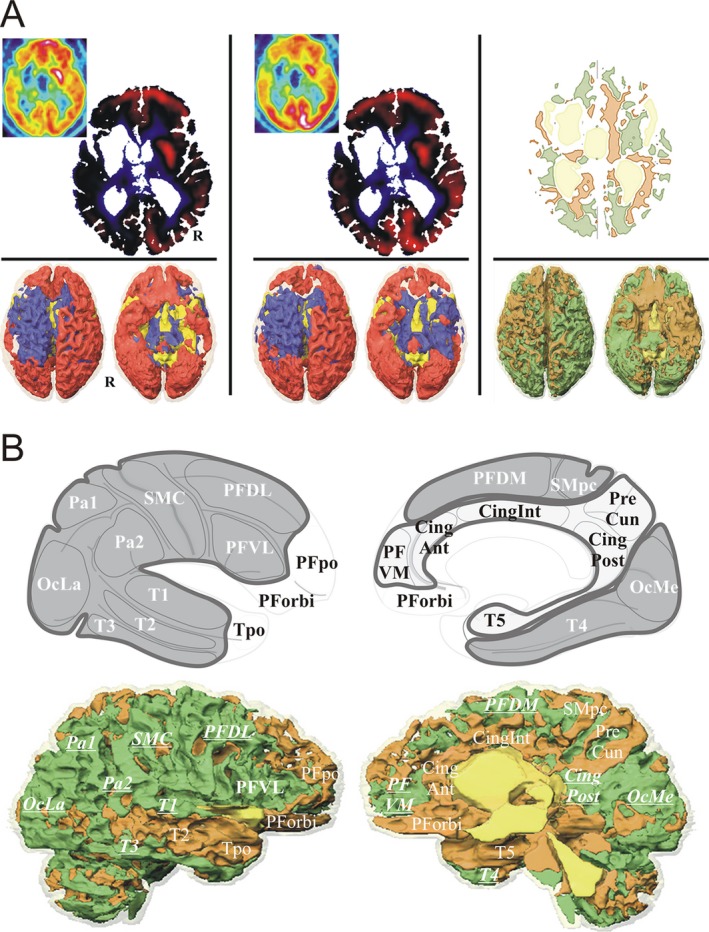
Figure 3.

FDG methods. (A) FDG normalization: Baseline (left column) and DBS‐ON (intermediate column) normalized FDG, and DBS‐ON minus Baseline normalized FDG variation (right column), example for P1: top row (4 mm above the anterior‐posterior commissure plane), left and intermediate columns (inlay, raw FDG slices), standardized uptake values of cerebral metabolic rate of glucose normalized by cerebral global mean (CGM) activity (red, above CGM; blue, below CGM), and right column, variation map (green, increase; beige, decrease); bottom row, 3D rendering (superior and inferior views) of normalized data (R, right hemisphere). (B) FDG metabolism by cortical region and area: Top row, cortical areas and regions: internal area (light gray) with prefrontal ventromedial (PFVM), precuneal (PreCun), cingulate anterior (CingAnt), intermediate (CingInt) and posterior (posterior, retrosplenial and isthmus; CingPost) and temporo mesial para hippocampal (T5) cortices; external area (dark gray) with prefrontal dorsolateral (PFDL), ventrolateral (PFVL) and dorsomedial (PFDM), sensorimotor central (SMC) and paracentral (SMpc), parietal superior (Pa1) and inferior (Pa2), occipital lateral (OcLa) and medial (OcMe), temporal T1 (T1), T2 (T2), T3 (T3) and fusiform gyrus (T4) cortices; other area (white) with prefrontal orbital (PForbi) and polar (PFpo), temporopolar (Tpo) and cerebellar (Cerb) cortices. Bottom row, specification of FDG activities by region: example P1, right hemisphere; bold underlined increased activity (upward variation).
