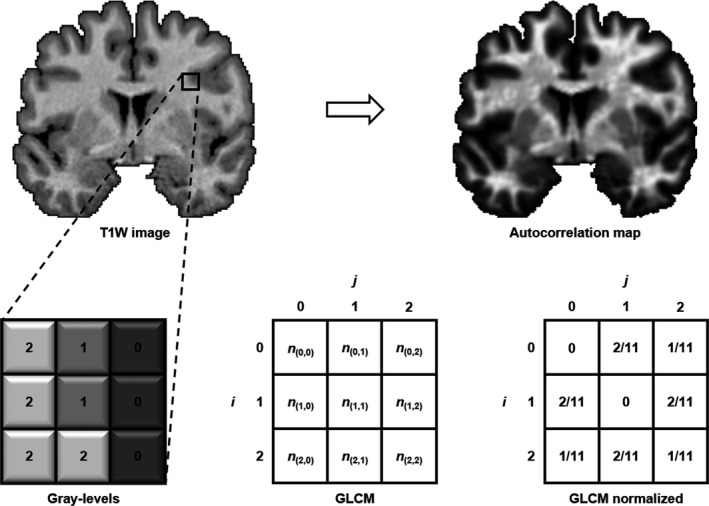
Figure 1.

Schematic representation of the creation of a gray level co‐occurrence matrix (GLCM) in a neighborhood of pixels in an image. Each cell in the GLCM matrix represents the number of times a certain pixel combination (i,j) co‐occurs in a particular direction. In this example, the GLCM is evaluated for θ = 0° (left‐right direction). Values are then normalized in the GLCM by dividing them by the sum of all co‐occurrences in the GLCM. Texture autocorrelation is then calculated from the normalized GLCM in every direction in each orthogonal plane (i.e. in three dimensions) to produce an autocorrelation map for each T1W image. Areas of increased autocorrelation (hyperintensity on the maps) represent regions where there is an increased probability of co‐occurrence of gray levels.
