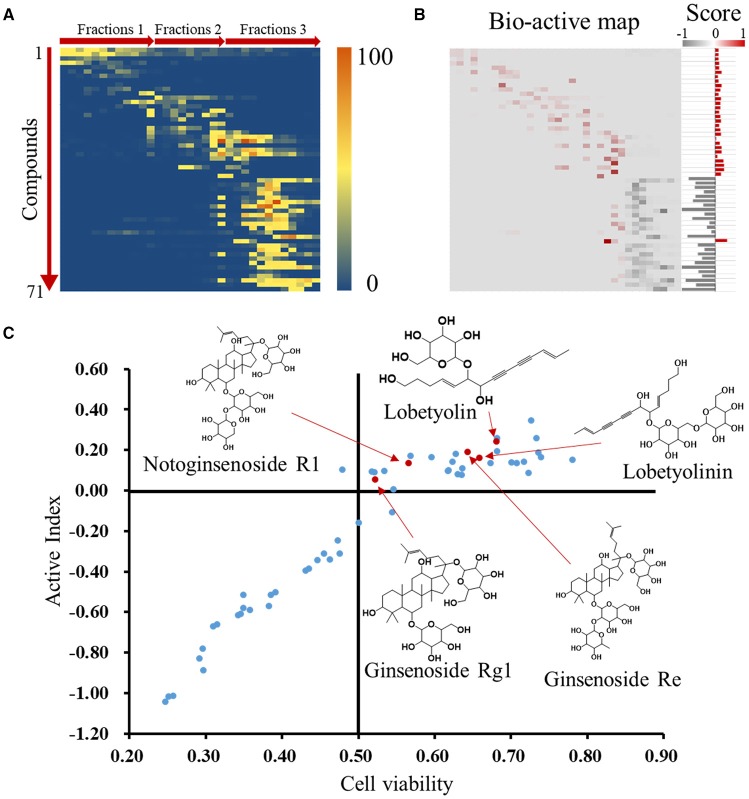
Figure 4.
Identification of active compounds by coefficient ranking. (A) Heatmap for relative content of identified compounds in each WXKL fractions. (B) Bio-active map was converted from content map and corresponding bioactivity coefficient in each fraction, and active indexes of identified compounds were calculated and showed on the right. (C) Compounds were plot by cell protection and bio-active scores and mass spectrum of several compounds on top. X axis means the contribution of compounds to the cardiomyocytes protection. Y axis means the AI of compounds.

