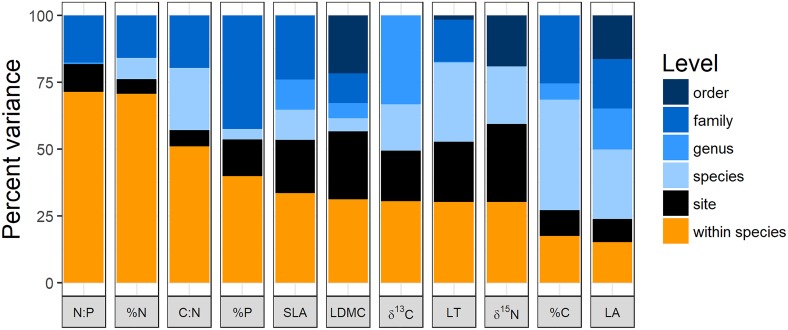
FIGURE 1.
Variance partitioning of leaf traits at different taxonomic levels and between populations across sites along the elevation gradient. LA, leaf area; LT, leaf thickness; LDMC, leaf dry matter content; SLA, specific leaf area; %C, % carbon content of leaves; %N, % nitrogen content of leaves; %P, % phosphorus content of leaves; C:N, carbon:nitrogen; N:P, nitrogen:phosphorus; δ13C, carbon 13 isotope ratio; δ15N, nitrogen 15 isotope ratio. Data for LDMC, LT, and LA were log transformed prior to analysis.

