Figure 2.
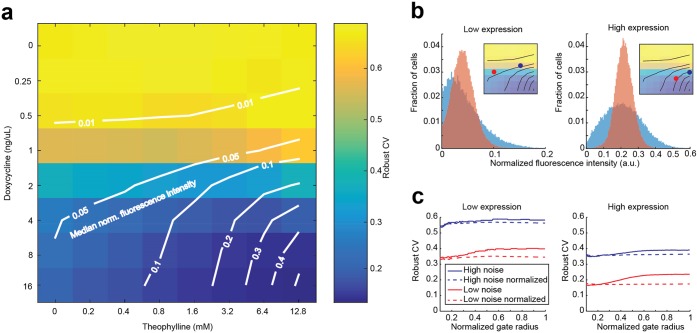
Gene expression noise is decoupled from mean expression by orthogonal control of transcription rate and mRNA degradation rate. (a) Median-noise landscape for noise-tuner expression at different combinations of doxycycline and theophylline concentrations. Colors indicate noise; lines indicate identical median normalized fluorescence, interpolated from the measured data (“isomedian lines”). At intermediate expression range, noise levels can be adjusted for a given median expression by use of different combinations of doxycycline and theophylline. The measured robust CV decreases when a median is reached with higher transcription rates and correspondingly lower mRNA degradation rates. (b) Example histograms of populations with similar median expression but different noise settings. Populations with higher mNeongreen transcription and mRNA degradation rates (red) display lower heterogeneity than populations with lower rates (blue). Insets indicate the compared populations from (a). (c) Deconvolution of measured noise. For populations shown in (b), noise is plotted against the radius of a circular gate around the median forward (FSC) and side scatter (SSC) values. Decreasing gate sizes lead to more homogeneous FCS-SSC populations, effectively filtering out the extrinsic component of the observed noise.4 In contrast to autofluorescence-subtracted raw data (solid lines), noise of autofluorescence-subtracted data normalized to a constitutively expressed mTurquoise2 reporter (dashed lines) is virtually independent of the gate size.

