
Figure 9.
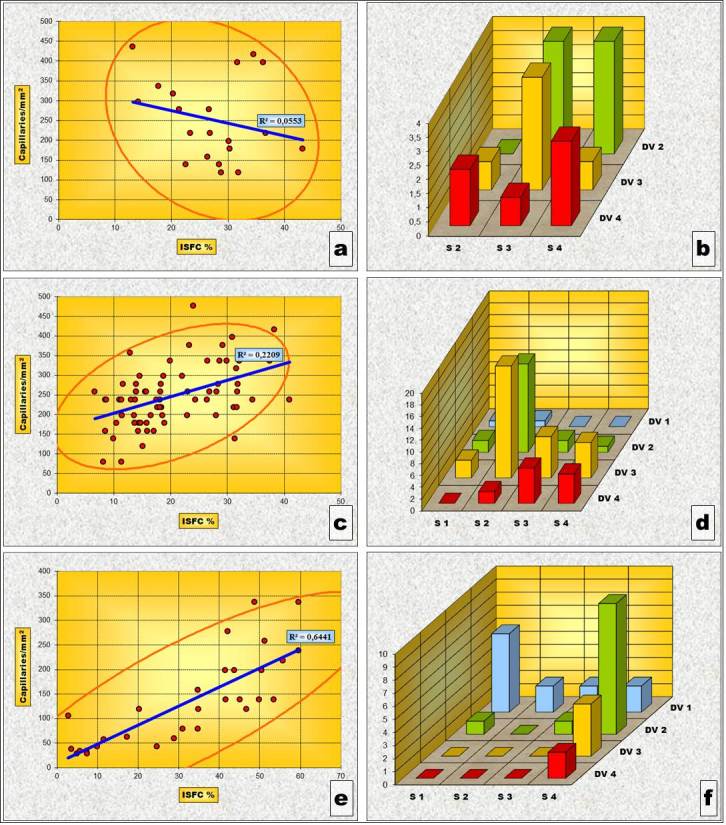
„Necrotizing” phenotype subtypes - Charts of Pearson’s correlation test and of χ2 – Test contingency tables for: Gleason 3c subtype (a and b), Gleason 4a subtype (c and d) and Gleason 5a subtype (e and f)
Official websites use .gov
A
.gov website belongs to an official
government organization in the United States.
Secure .gov websites use HTTPS
A lock (
) or https:// means you've safely
connected to the .gov website. Share sensitive
information only on official, secure websites.
„Necrotizing” phenotype subtypes - Charts of Pearson’s correlation test and of χ2 – Test contingency tables for: Gleason 3c subtype (a and b), Gleason 4a subtype (c and d) and Gleason 5a subtype (e and f)