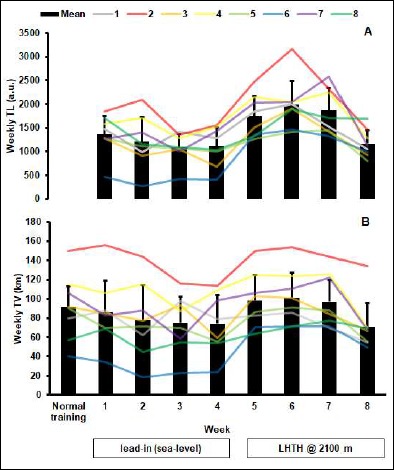
Figure 1.

A) Quantification of weekly TL and B) weekly TV during lead-in and intervention periods. Histograms represent the mean response, and coloured lines the individuals indicated in the legend. Week 7 represents the 3rd week for athletes completing 4 weeks of LHTH (n = 5), with week 8 being the final week for all (n = 8). Normal training is the 4 weeks prior to the commencement of the study, TV was habitually recorded by participants during this period, however TL was not quantified.
