. 2018 Sep 10;9(44):8402–8408. doi: 10.1039/c8sc03393e

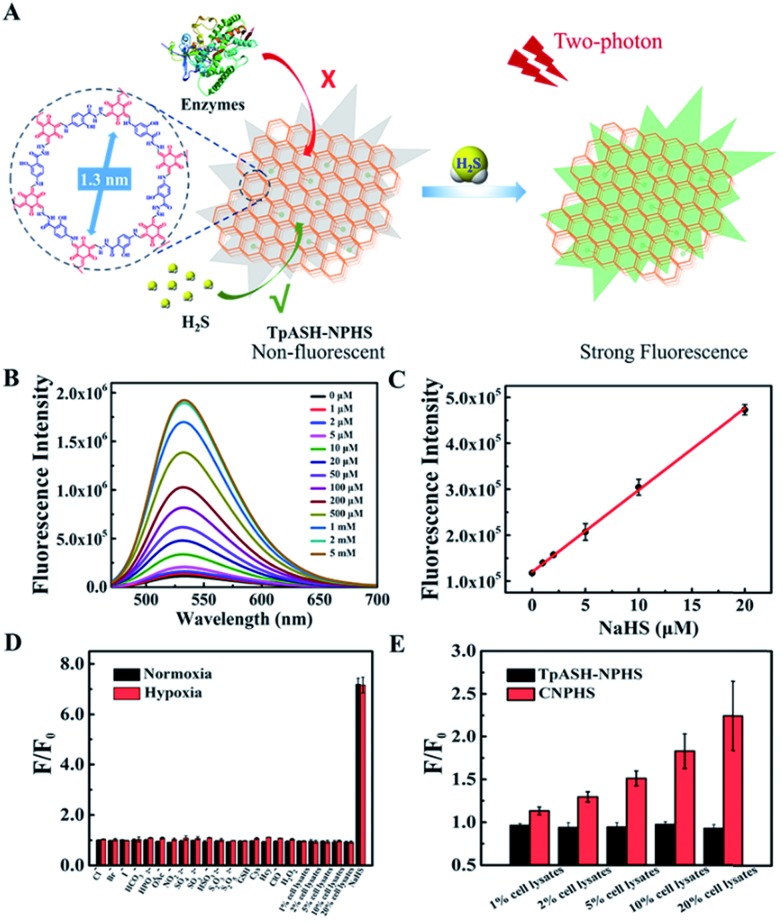
Fig. 2. Interference-resistant fluorescence sensing of the COF nanoprobe TpASH-NPHS. (A) Constitution and mode of action of the COF-based nanoprobe TpASH-NPHS. (B) The fluorescence emission spectra of TpASH-NPHS in the presence of different concentrations of NaHS. (C) Linear response at low NaHS concentrations, R2 = 0.998. The standard curve of the TpASH-NPHS response to NaHS is y = 119 908.37448 + 17 831.54373x. λex = 440 nm. (D) Fluorescence response of TpASH-NPHS to various substances under normoxic (21% O2) and hypoxic (<0.1% O2) conditions. (E) The comparison of fluorescence response between TpASH-NPHS and CNPHS to different concentrations of HepG2 cell lysates under hypoxia.

Fig. 2