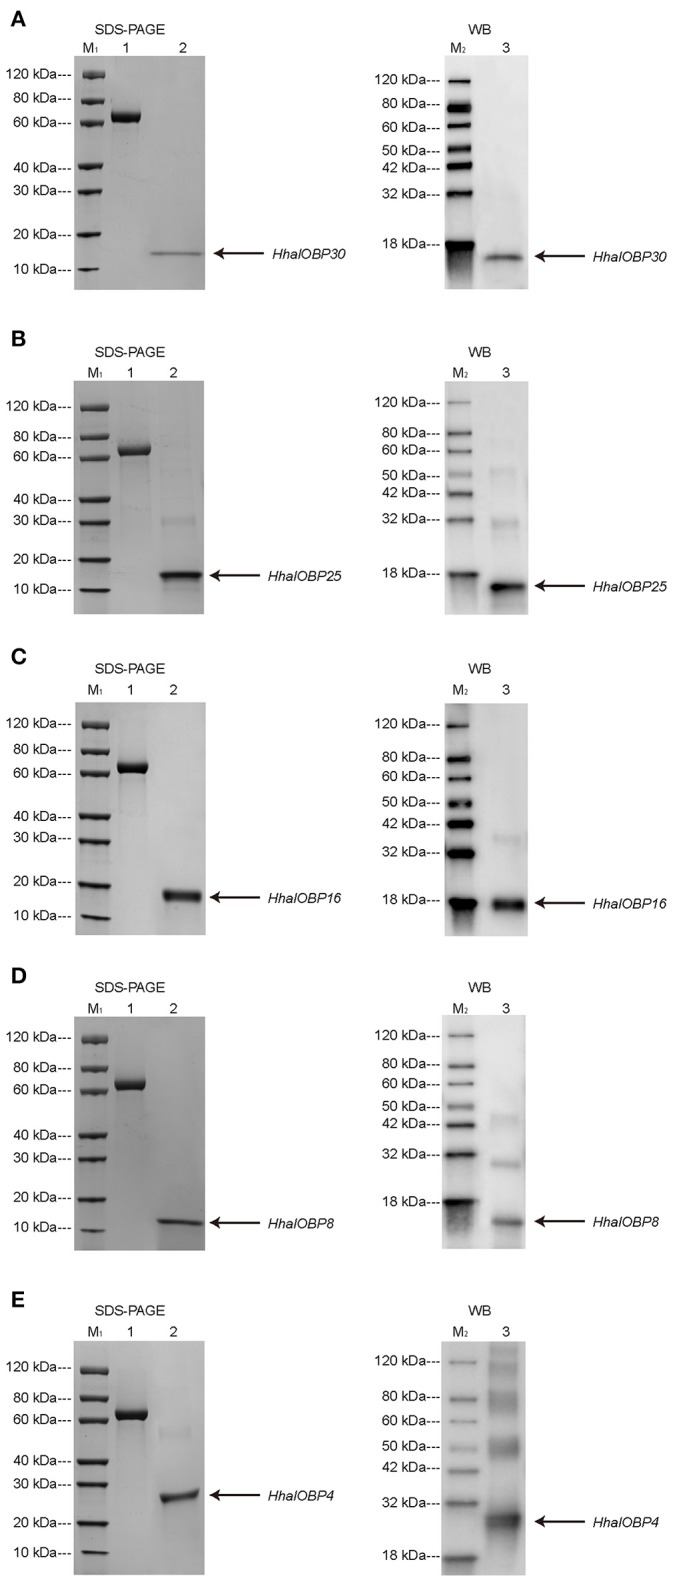
Figure 5.

SDS-PAGE (left) and Western blot (right) analysis for purified H. halys OBP30 (A), H. halys OBP25 (B), H. halys OBP16 (C), H. halys OBP8 (D), and H. halys OBP4 (E) expression. Arrows indicate the protein bands. M1 and M2 were molecular markers. 1: bovine serum protein as a reference. 2 & 3: purified OBPs.
