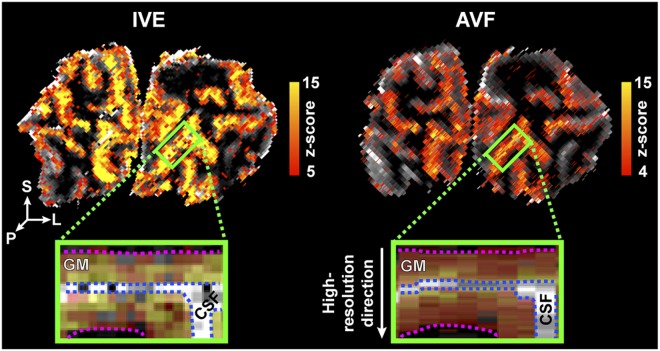
Figure 2.
Example of single-subject, single-run activation maps for the flickering checkerboard stimulus, overlaid on the MI-EPI and the MP2RAGE T1 maps for the IVE (left) and AVF (right) acquisitions, respectively. The green rectangle indicates the ROI in a coronal slice through the occipital lobe. In the zoomed-in panels, the dotted pink line indicates the GM-WM border and the blue line the GM-CSF border. In the activation maps, the values for CSF are masked out to better visualize the ‘flat’ cortical patch of interest.

