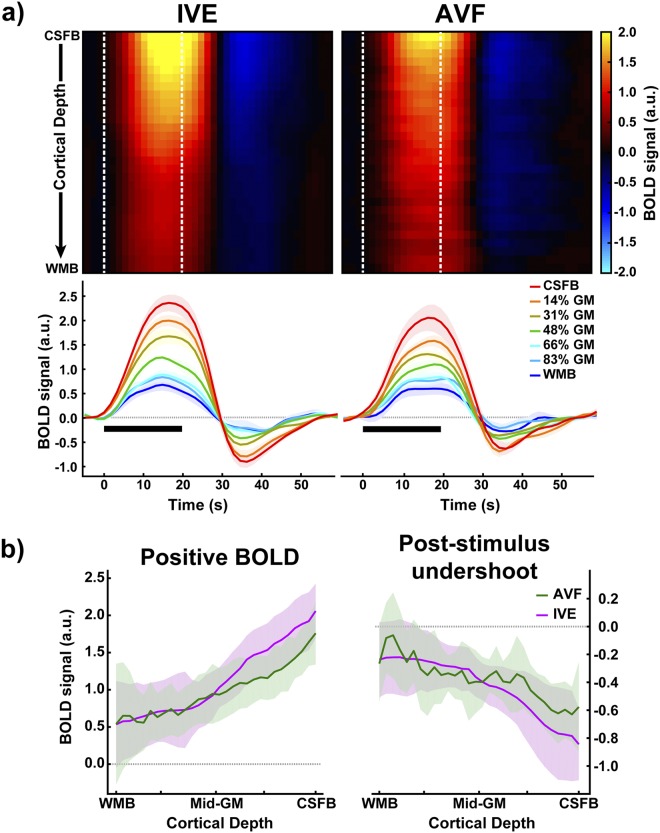
Figure 3.
(a) Top: Colour-map representation of the average hemodynamic timecourses for 30 cortical depths from the IVE (left) and the AVF (right) acquisitions from CSF boundary (CSFB) to the white matter boundary (WMB). The white dotted lines on the colour-map indicate the stimulus-on period. Seven of the 30 cortical depth timecourses are presented below the heatmaps. (b) Cortical depth profiles of the average positive BOLD signal and post-stimulus undershoot for the two acquisition schemes. The BOLD signals have been normalized (see SI Methods) and the shaded regions represent the standard error of the mean (SEM).

