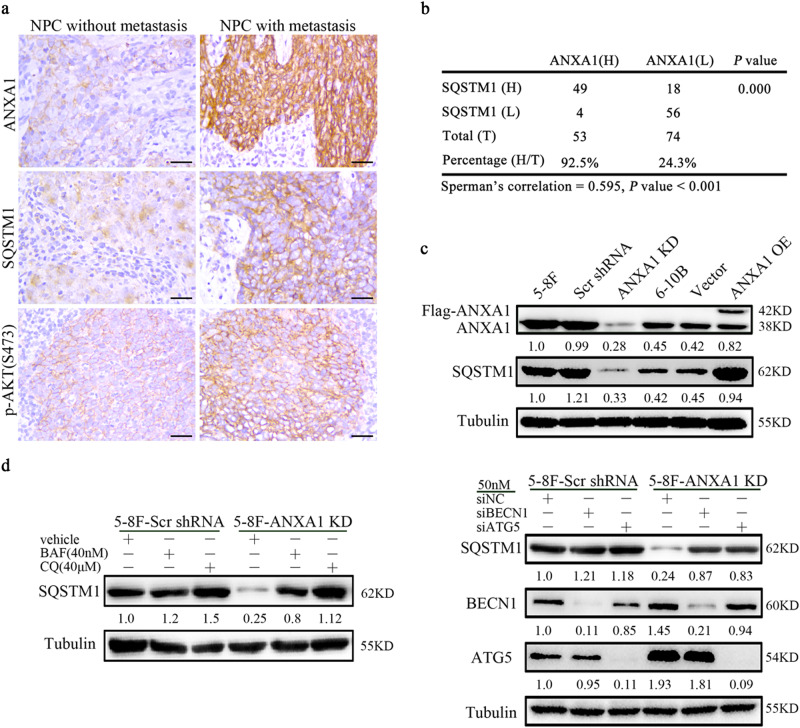
Fig. 1. ANXA1 is correlated with SQSTM1 expression and metastasis in NPC.
a Representative immunohistochemistry showing the expression levels of ANXA1, SQSTM1, and p-AKT (S473) in the NPCs with different metastatic potentials. Scale bar = 50 μm. b Correlation analysis of ANXA1 and SQSTM1expressin in 127 NPCs based on immunohistochemistry scores (Spearman’s correlation test). c ANXA1 positively regulating SQSTM1 expression. Western blot analysis showing the expression levels of SQSTM1 in the ANXA1 KD 5–8F cells, ANXA1 OE 6–10B cells and their control cells. d ANXA1 regulating SQSTM1 expression through autophagy. Western blot analysis showing the expression levels of SQSTM1 in the ANXA1 knockdown 5–8F cells and scramble shRNA control cells treated with BAF or CQ (left) or transfected with BECN1 or ATG5 siRNA (right). Scr, scramble. Vector, an empty vector; KD, knockdown; OE, overexpression; BAF, bafilomycin A1; CQ, chloroquine

